Debugging a debugger is a tricky business. You often need another debugger, but it can also be broken and so, that's why Firebug team has invented a set of helper tools that are essential for Firebug development.
In this post I am providing a brief summary of tools that we use when working on Firebug.
Take a sneak peek into the world of Firebug development and see what is it composed from!
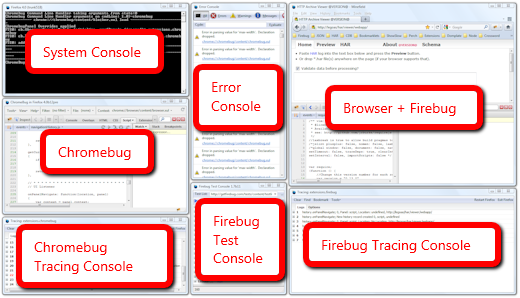
Click to enlarge the image.
- Browser + Firebug Of course, this is the essential window. The browser window with Firebug opened at the bottom (there is usually not enough space on the screen to have Firebug detached in a new window).
- Firebug Tracing Console If something goes wrong in Firebug there is a Firebug Tracing Console. This console displays various logs recorded as Firebug is running. This is often the window where we can sight an error and using associated stack trace discover the right place withing the Firebug source and start debugging.
- Chromebug This is the Firebug debugger. Chromebug is based on Firebug source base (the UI is the same). It allows debugging any Firefox extension (aka Firebug for Firefox extensions), well except of Chromebug itself. Invented by awesome John J. Barton and indispensable for Firebug development.
- Chromebug Tracing Console Even Chromebug can be attacked by bugs and so, this tracing console displays logs coming from Chromebug source. There is no other debugger for Chromebug so, it's often the only way how to fix a bug in Chromebug.
- Firefox Error Console If everything else is broken we also use Firefox Error Console. It's pretty old, no stack trace, often useless.
- System Console At some point good old dump() into the system console can be also an effective strategy how to hunt a bug. Slow, sometimes frustrating, but hey, software isn't always easy!
- Firebug Test Console Finally, in order to verify that Firebug is still working, after a bug dies, we have a set of tests. This console represents the test harness that run our automated tests and displays results.
Some of these tools are integrated and so, for example, Test Console also uses FB Tracing Console, Chromebug can be opened by clicking on a stack trace in the FB Tracing console, bug in the Test Console can be hunted using Chromebug, etc.
Frankly, isn't that all exciting?! 🙂
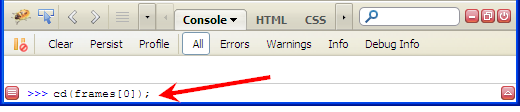
Firebug command line allows executing JavaScript expressions within context of the current page. Firebug also provides a set of built in APIs and one of them is cd().
cd(window) By default, command line expressions are relative to the top-level window of the page, cd() allows you to use the window of a frame in the page instead.
There is several ways how to use this method. First, let's imagine following page:
<html xmlns="http://www.w3.org/1999/xhtml">
<head>
<title>Console Test Page</title>
</head>
<body>
<iframe id="frameID" name="frameName" src="iframe.html" />
</body>
</html>
cd(document.getElementById("frameID").contentWindow); switch to a frame by IDcd(window.frames[0]); switch to the first frame in the list of framescd(window.frames["frameName"]); switch to a frame using by namecd(window.top); switching back to the top level window
Check the example page online.
See all Firebug tips
Firebug inspector is certainly one of the most valuable Firebug features and it also deserves more attention from extension developers. From this reason Firebug 1.7a10 introduces a new API that allows reusing this feature in Firebug extensions and customize its behavior.
This part of Firebug extension tutorial explains how to use this API in Firebug extensions.
Firebug Inspector
Let's see a quick overview of what is actually the Firebug inspector and how it works from the user perspective.
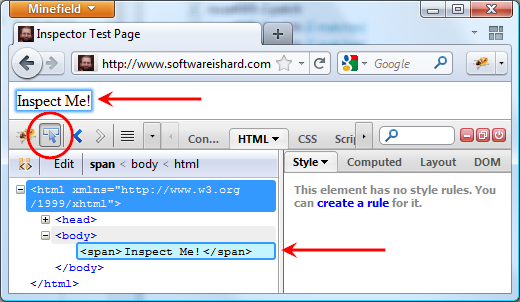
- Clicking on the inspector button starts an inspecting mode.
- As the user moves the mouse cursor over page elements, they are automatically highlighted.
- The HTML panel (selected by default) shows detailed information about the currently highlighted element.
- The inspecting mode can finished by clicking on the inspecting page element or canceled by pressing ESC key.
Read more...
One way how to break JavaScript execution and let a debugger to halt on specific line of source code is using a breakpoint. Less known alternative (and also less useful I guess) is a debugger keyword.
One obvious drawback of using this keyword is lack of flexibility. You need to modify the source code to use it and modify again to get rid of it.
A problem has come up when you need to debug a code that contains debugger keywords and you can't remove it. And this is where Firebug can become handy tool again.
See all Firebug tips
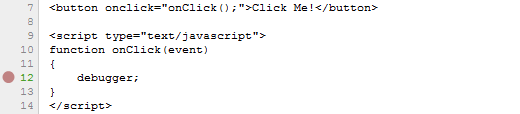
Let's image following script:
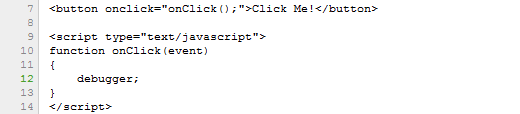
If onClick method is executed Firebug shows following bubble that offers disabling.
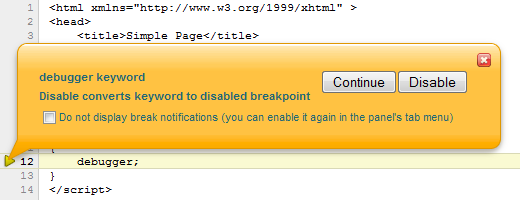
The 'Do not display...' check-box has been introduced in Firebug 1.7a10.
If you pressed the Disable button, a disabled breakpoint has been created on the same line. A breakpoint has higher priority over debugger keyword and since it's disabled it also effectively disables the keyword.
It's just a standard breakpoint so, you can remove it in the Breakpoints side panel. If you have Firebug installed try it now, otherwise you need to install it first.


