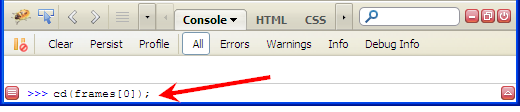
Firebug command line allows executing JavaScript expressions within context of the current page. Firebug also provides a set of built in APIs and one of them is cd().
cd(window) By default, command line expressions are relative to the top-level window of the page, cd() allows you to use the window of a frame in the page instead.
There is several ways how to use this method. First, let's imagine following page:
<html xmlns="http://www.w3.org/1999/xhtml">
<head>
<title>Console Test Page</title>
</head>
<body>
<iframe id="frameID" name="frameName" src="iframe.html" />
</body>
</html>
cd(document.getElementById("frameID").contentWindow); switch to a frame by IDcd(window.frames[0]); switch to the first frame in the list of framescd(window.frames["frameName"]); switch to a frame using by namecd(window.top); switching back to the top level window
Check the example page online.
See all Firebug tips
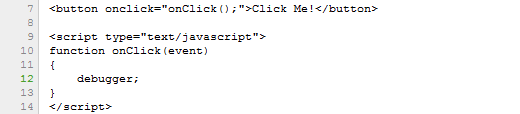
One way how to break JavaScript execution and let a debugger to halt on specific line of source code is using a breakpoint. Less known alternative (and also less useful I guess) is a debugger keyword.
One obvious drawback of using this keyword is lack of flexibility. You need to modify the source code to use it and modify again to get rid of it.
A problem has come up when you need to debug a code that contains debugger keywords and you can't remove it. And this is where Firebug can become handy tool again.
See all Firebug tips
Let's image following script:
If onClick method is executed Firebug shows following bubble that offers disabling.
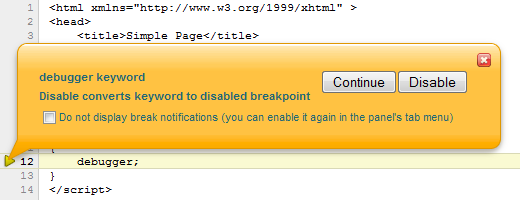
The 'Do not display...' check-box has been introduced in Firebug 1.7a10.
If you pressed the Disable button, a disabled breakpoint has been created on the same line. A breakpoint has higher priority over debugger keyword and since it's disabled it also effectively disables the keyword.
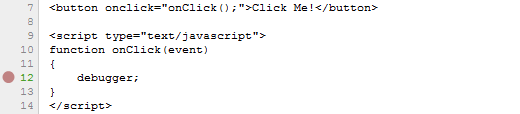
It's just a standard breakpoint so, you can remove it in the Breakpoints side panel. If you have Firebug installed try it now, otherwise you need to install it first.
The feature I am going to describe in this post would definitely deserve a better visual representation since almost nobody I've asked doesn't know about it.
Anyway, despite this visual imperfection it's very useful for any developer who deals with pages that contain number of script files.
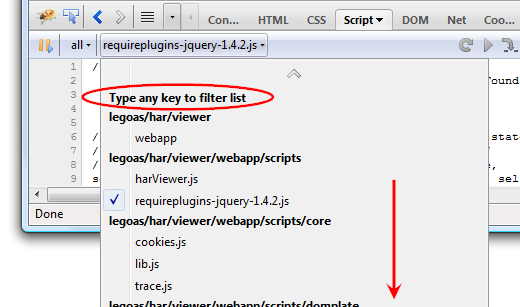
See the following screen-shots. It shows a list of scripts included in the current page.
See all Firebug tips
The list of scripts is pretty long (didn't fit in the image) and you even need to scroll the menu content to see its end. Important is the plain Type any key to filter list note at the top!
If you start typing at this moment, the list will be automatically filtered.
Read more...
Here is a brief tip post about the well known Firebug's inspector feature and its integration with the command line.
You need Firebug 1.7a4 that fixes a bug in command line APIs (the fix will be ported into 1.6b3)
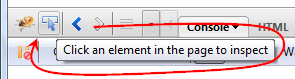
When the inspector is used to inspect the current page, Firebug is automatically keeping a history of recent inspected elements. The history is consequently accessible in the command line through following command line APIs.
$0 The currently selected object in the inspector.$1 The previously selected object in the inspector.$n(index) Access to an array of last 5 inspected elements.
See all Firebug tips
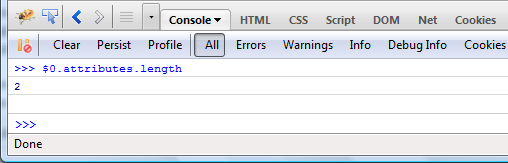
So, you can use $0 as a variable pointing to the currently inspected element and pass it to another functions or access it's properties.
For example, right click on the above screen-shot and pick Inspect Element. Switch to the Console panel and use $0 in the command line to get number of attributes.
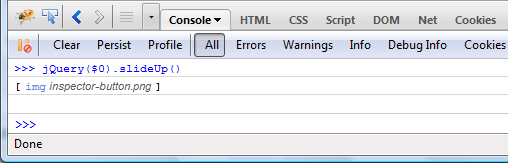
jQuery in the command line
Here is another example that uses jQuery APIs in the command line. The $0 element is passed into the jQuery function as a parameter (slideUp method animates the height of the element).
If the current page doesn't use jQuery, you can install it quickly using a jQuerify bookmarklet.
This post is updated to reflect changes in the specification. You need Firebug 1.6X.0a12
Firebug 1.6X.0a12 implements a new console.table method that allows output of tabular data into the Console panel. This feature was suggested by Patrick Mueller who works on webkit based on a similar feature implemented in FirePHP by Christoph Dorn.
Before diving into various scenarios and details how to use this new method, let's see a simple preview of a tabular output.
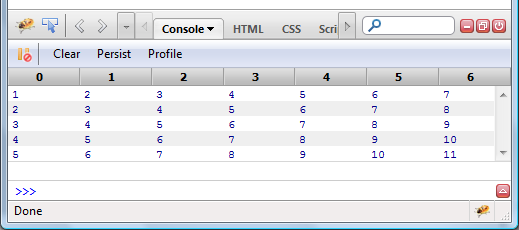
This table corresponds to a following code:
var table1 = new Array(5);
for (var i=0; i<table1.length; i++)
table1[i] = [i+1, i+2, i+3, i+4, i+5, i+6, i+7];
console.table(table1);
Read more...


