
Firebug HTTP Time Monitor
by Honza- Published:October 23rd, 2009
- Comments:27 Comments
- Category:Firebug, Planet Mozilla
I have been waiting for a long time to write about this great news. Since bug #488270 has been fixed in Firefox 3.6 (beta), Firebug 1.5 (beta) uses a new API to measure timing of underlying network activity more precisely.
Firebug now uses a component called http-activity-distributor that allows to register a listener and get notifications about various phases of each network request (DNS Lookup, connecting, sending, etc.). The most important thing is that one of the parameters passed to the listener is a time-stamp. This is something what was missing till now.
Having the time-stamp is critical since Javascript code (and Firebug is entirely implemented in Javascript) is executed on Firefox UI thread. In case when the UI is blocked by time expensive operation (e.g. DOM rendering, script execution, etc.) any event sent to a Javascript handler (and so, handled on the UI thread) can be delayed. So, getting the time-stamp withing JS handler can produce impaired time results.
Firebug Net panel now fixes this problem and the timing info is correct. See couple of examples I have analyzed when testing with a nice online tool called Cuzillion developed by Steve Souders.
Inline Scripts Block
Inline scripts block downloads and any resources (e.g. images) below an inline script don't get downloaded until the script finishes execution.
Let's imagine a page with following structure.
<head></head>
<body>
<img src="resource.cgi" />
<script> {an inline script running for 5 sec } </script>
<img src="resource.cgi" />
</body>
</html>
Here is a timeline of such page displayed in Firebug.
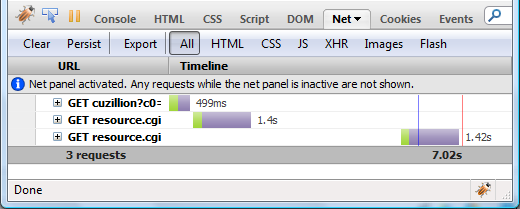
The first image resource.cgi starts downloading immediately after the page itself is downloaded. The second image resource.cgi starts downloading after 5 sec delay caused by the inline script. Try the example online.
The green area represents connecting time an the purple area represents waiting for response time. The blue line shows when DOMContentLoaded event was fired and the red line is associated with page load event.
Connection Limit
Firefox limits the number of connections per server to 6. If the limit is reached other requests wait in an internal queue. This value can be changed by editing network.http.max-persistent-connections-per-server preference in about:config
See how the timeline looks like for a page that loads 8 images.
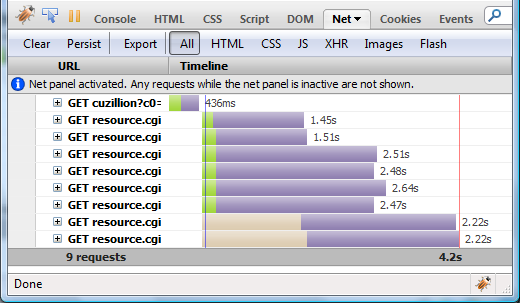
See the last two images. These are waiting in a queue (light brown area) till there is a free connection. The 7th image starts downloading as soon as the first image finishes and share the same connection (see, there is no green connection time). Similarly, the 8th image starts when the 2nd is completed. Try the example online.
Not to forget, you need Firebug 1.5b1+ and Firefox 3.6b2pre+


27 Comments
So excited to see this. In most cases, the UI blocking isn't an issue. But occasionally I work with pages that have a lot of JS that used to block net panel and produce inaccurate timings. This is a great fix.
[...] Software is hard | Firebug HTTP Time Monitor http://www.softwareishard.com/blog/firebug/firebug-http-time-monitor – view page – cached More musings on software development — From the page [...]
WOW! This is awesome. 🙂
Excellent work
[...] post: Software is hard | Firebug HTTP Time Monitor By admin | category: cgi script | tags: after-the-page, first-image, inline, page-itself, [...]
Honza, towards the end of his last post, Tonda has raised a good question:
http://blog.binaryage.com/rebug-record-the-bug-and-replay-it-later/
HAR should be replayable. It seems to me like this would be a natural Firebug functionality.
a) right-click on a request in Net panel and say "replay" or "send again"
b) load a HAR and replay the whole thing
As an example of a use-case: I was debugging our Javascript application yesterday through an HTTP Proxy/Cache, and was getting an 406 error in about 50 other successful XHR requests. After every change on the server-side, I had to reproduce the same workflow and submit all 50 requests in order to get to the point where the app was submitting the faulty request. Being able to click on the request and resubmit it would save me lots of time.
@Jakub: Agree, this would be very useful. I recall that somebody already requested this feature. Thanks for the link to Tonda's post!
That's really awesome. I wonder if it would be possible to add the execution of Javascript to this graph for situations where it blocks loading - having a bar between the two images in your first example that linked the inline script to the gap would greatly simplify debugging this sort of thing.
@Ben: Yes, I have been also thinking about a new bar that illustrates the blocking time (javascript execution) and I think this should be possible. I am more worried about the link to the inline script. I am not aware of any APIs that would provide this information. Anyway, this would be really great feature, I'll try to look around. Thanks for the tip!
[...] For more details on the implementation and use of the newly-improved Net panel, see Honza’s blog post on the [...]
[...] For more details on the implementation and use of the newly-improved Net panel, see Honza’s blog post on the [...]
I'm using this to time my large css file. I see results like:
Waiting 15ms Receiving 235ms
Then I clear my cache and refresh and I see different numbers like:
Waiting 94ms Receiving 172ms.
Do you know the receiving times so different?
I'm trying to get consistent timing results so I can measure my improvements to the css file (like removing whitespace). thanks!
@Jeanne: My first recommendation would be to use Firebug 1.5 + Firefox 3.6 (an important bug was fixed in Fx 3.6 and the timing in Firebug is much more precise). Do you use this configuration?
http://getfirebug.com/releases/firebug/1.5X/
Yes, I'm using Firefox 3.6Beta4 and Firebug 1.5x.0b5.
Cool. The Waiting time increase seems to be rational - after you clear the cache the CSS file has to be downloaded again and the response can take more time. As far as the Receiving time is concerned, I would expect bigger number (after clear cache), but it could happen that the cache read takes more time than the actual download. Do you have an online test I could try?
This is a similar website to what I'm trying and it's public and I get similar results. http://www.irian.at/trinidad-demo/faces/index.jspx
I go to Firefox's Options->Advanced->Clear Now. Press Ok, then refresh the browser, and I do this same thing over and over and over.
The minimal-desktop-*.css file's NetPanel Receiving times bounce all over: 15ms, 0ms, 0ms, 172ms, 125ms.
What is this Receiving number? Is it the amount of time the browser takes to fully receive the file, but not apply all the css rules to the page? Or does it include applying the css rules to the page (I'd like to measure both somehow). And I'd like the measurements to be consistent, but I don't know how to do this. Thanks!
The Receiving number is elapsed time the browser needed to download a response. If I load the page the first time (cache empty) I see that about 100-200ms was needed to download the css file. When I consequently refresh the page (css coming from the cache) I always see 0 for Receiving, which make sense since the response came from the cache so - no download. Note that there are two numbers for each phase, the first number e.g. +45ms says that a phase (e.g. Receiving) started 45ms after the request originated and the second is elapsed time of the phase. The timings info doesn't cover the time spent when css rules are applying to the page.
Hi, Thanks for the information. If I refresh the page without clearing the cache, I too see 0ms which I expect. If I clear the cache every time, I see varying results: 313ms, 0ms, 219ms, 157ms, 0ms, 0ms, 140ms, 187ms, 0ms, 0ms, 0ms, 156ms.
What is reason these numbers vary so much? I was hoping I could use this number to test performance of my css file - smaller file should be faster, file without whitespace should be faster, etc.
[...] timing - Similar to the issues I discovered in Firebug Net Panel, long-executing JavaScript in the main page blocks the network [...]
[...] timing – Similar to the issues I discovered in Firebug Net Panel, long-executing JavaScript in the main page blocks the network [...]
[...] Net Paneli: Net panelindeki zamanlama hataları giderilmiş ve geliştirilmiş. Net panelin çalışma mantığı değiştirilmiş ve tam sonuçların alınması sağlanmış. Ayrıntılı bilgi için tıklayınız. [...]
[...] Net Paneli: Net panelindeki zamanlama hataları giderilmiş ve geliştirilmiş. Net panelin çalışma mantığı değiştirilmiş ve tam sonuçların alınması sağlanmış. Ayrıntılı bilgi için tıklayınız. [...]
I don’t especially care what Mozilla does or does not support; it’s not practical for me to use anything but 64-bit builds. When things don’t work I file bugs. Are you saying that there is nothing that Firebug does that *should* break on a Gecko runtime built with 64-bit pointers? Have you filed bugs on what does break?
@mhunter: Not sure how 64-bit build problems is related to this post. Anyway, I am personally not using 64-bit Firefox build so, I don't have any test case (if you do, please report it). And yes, there is nothing that Firebug does that should break on 64-bit build.
[...] Net Paneli: Net panelindeki zamanlama hataları giderilmiş ve geliştirilmiş. Net panelin çalışma mantığı değiştirilmiş ve tam sonuçların alınması sağlanmış. Ayrıntılı bilgi için tıklayınız. [...]
timing - Similar to the issues I discovered in Firebug Net Panel, long-executing JavaScript in the main page blocks the network
2 DergiLand: Do u personally have filed bugs?