
How to debug Firebug!
by Honza- Published:February 22nd, 2011
- Comments:5 Comments
- Category:Planet Mozilla
Debugging a debugger is a tricky business. You often need another debugger, but it can also be broken and so, that's why Firebug team has invented a set of helper tools that are essential for Firebug development.
In this post I am providing a brief summary of tools that we use when working on Firebug.
Take a sneak peek into the world of Firebug development and see what is it composed from!
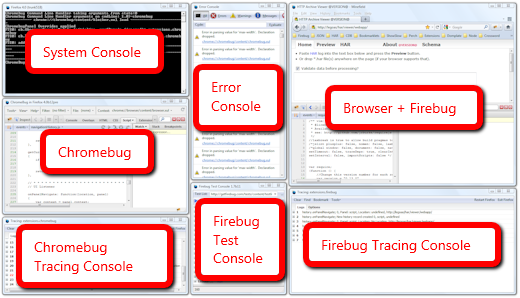
Click to enlarge the image.
- Browser + Firebug Of course, this is the essential window. The browser window with Firebug opened at the bottom (there is usually not enough space on the screen to have Firebug detached in a new window).
- Firebug Tracing Console If something goes wrong in Firebug there is a Firebug Tracing Console. This console displays various logs recorded as Firebug is running. This is often the window where we can sight an error and using associated stack trace discover the right place withing the Firebug source and start debugging.
- Chromebug This is the Firebug debugger. Chromebug is based on Firebug source base (the UI is the same). It allows debugging any Firefox extension (aka Firebug for Firefox extensions), well except of Chromebug itself. Invented by awesome John J. Barton and indispensable for Firebug development.
- Chromebug Tracing Console Even Chromebug can be attacked by bugs and so, this tracing console displays logs coming from Chromebug source. There is no other debugger for Chromebug so, it's often the only way how to fix a bug in Chromebug.
- Firefox Error Console If everything else is broken we also use Firefox Error Console. It's pretty old, no stack trace, often useless.
- System Console At some point good old dump() into the system console can be also an effective strategy how to hunt a bug. Slow, sometimes frustrating, but hey, software isn't always easy!
- Firebug Test Console Finally, in order to verify that Firebug is still working, after a bug dies, we have a set of tests. This console represents the test harness that run our automated tests and displays results.
Some of these tools are integrated and so, for example, Test Console also uses FB Tracing Console, Chromebug can be opened by clicking on a stack trace in the FB Tracing console, bug in the Test Console can be hunted using Chromebug, etc.
Frankly, isn't that all exciting?! 🙂


5 Comments
We need 10 monitors to debug them all! :E
But there's a bug in the debugger! We need to go deeper...
(Sorry, I just watched Inception...)
it's debugger all the way down..
This post will be very useful for anyone wanting to get involved in Firebug. Good idea.
Chromebug looks awesome since I last saw it (long time ago). Almost makes me think XUL development might be worthwhile going back to since Jetpack seems to either be too limited or too undocumented 🙁 So far at least.
@pd: yes, one of the reasons to write down this post was to encourage developers to contribute to Firebug.