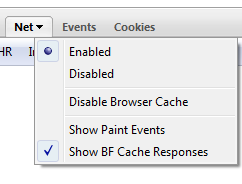
Another new feature that made it into Firebug 1.6a14 (available later today) is tracking HTTP responses coming directly from Firefox BFCache (back/forward cache) and displaying them within the Net panel.
The purpose of this cache (note that this is different from the standard HTTP cache) is to make navigation in the browser history fast.
The consequence of using the BFCache is that there is no HTTP activity (that's why it's fast) and so, till now these requests wasn't displayed in the Net panel.
While I think it was actually correct (since purpose of the Net panel is to monitor HTTP activity), it was confusing sometimes as the Net pane was empty even if it was quite obvious that there need to be some requests.
So, the feature is optional (on by default).

All responses coming from the BFCache are displayed in gray. See the next screen-shot that shows what happened when I pressed the Back button.

One thing I am still not sure about is whether the gray color is enough to distinguish BFCache responses from regular HTTP responses...
Another way how to differentiate these two different responses is depicted here (just a mock-up):

BFCache response could be hidden behind an extra entry that clearly depicts that it's BFCache related. This would make the Timeline column a bit hard to read since there would be empty rows in the waterfall diagram, but perhaps nobody is interested in that if it doesn't come from the server and there is not HTTP communication anyway.
What do you think?
Any tips how to cut the Gordian knot?
One of the new features introduced in Firebug 1.6a14 (will be available later today) is a possibility to use the command line also from other panels (not only from the Console panel).
This feature has been requested for a long time and since the command line is one of the most important parts of Firebug, we decided to jump on this and ship the support yet with Firebug 1.6.
As usual let's see how this feature looks like from the UI perspective.

In this particular case, Firebug is opened in a new window (detached), but the same works also for Firebug displayed at the bottom of a browser window (attached).
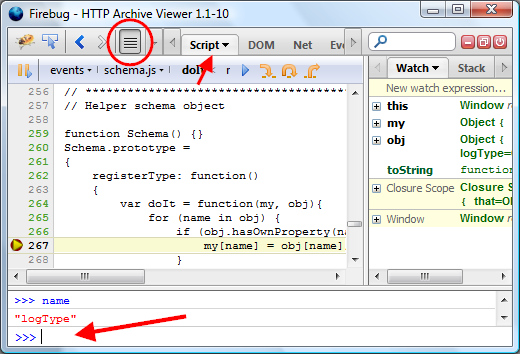
You can see a few new things:
- There is a new button in the Firebug toolbar. This one is used to show/hide the command line.
- The Script panel is now selected.
- And voilà, here is the Command line!
The screenshot also indicates usage of the command line during debugging. When the Javascript execution is stopped at a breakpoint, the user can use the command line for expression/variable evaluation. In some cases it's faster than using the watch window, especially if you want to see the result just temporarily and don't want to create an extra entry in the Watch window (which would have to be removed later).
Visibility of the command line can be also controlled by a keyboard shortcut. If it's opened and the user presses the Escape key, it's closed, second snap on the same key opens it again.
I believe that this feature opens the door for further improvements, like for example drag and drop of the selected text from e.g. the Script panel into the command line for auto-evaluation.
Please if you have any tips how this feature could be yet improved, post a comment here or follow up in the news group, thanks!


