Firebug 2 (released today!) uses number of internal architectural concepts that help to implement new features as well as effectively maintain the code base.
Using transparent architecture and well known design patterns has always been one of the key strategies of the (relatively small) Firebug team that allows us maintain rather large set of features in Firebug.
This post describes the way how Firebug deals with JavaScript object representation and the concept ensuring that an object is always rendered the same way across entire Firebug UI.
- Firebug 2.0 is compatible with Firefox 30 - 32
See also list of new features in Firebug 2
Firebug Internals I.
Read more...
One of the achievements of Firebug 2 alpha 1 release has been adoption of new JSD2 API and this task required significant changes and improvements in our code base. Among other things, we have also introduced a new concept that allows to nicely build asynchronously updated UI.
There are other concepts in Firebug 2 and this version is with no doubt the best one we have released. Try it and let us know how it works for you (Firefox 30+ needed).
In order to implement remote access to the server side debugger API, Firebug UI needs to know how to deal with asynchronous update. We applied Viewer Provider pattern and extended it with support for asynchronous data processing.
If you like using Document View, Model View Controller or similar design patterns to build your code base, you'll probably like Viewer Provider too.
So, follow this post if you are interested to know what Viewer Provider looks like.
Read more...
Firebug 2 (first alpha) has been released this week and it's time to checkout some of the new features. Note that you need at least Firefox 30 to run it.
This brand new version introduces a lot of changes where the most important one is probably the fact that it's based on new Firefox debugging engine known as JSD2.
Also Firebug UI has been polished to match Australis theme introduced in Firefox 29.
Read more...
I couldn't miss this nifty extension in my series of posts about Firebug extensions. It's a small plugin focused on one thing and working great!
This extension is compatible with Firebug 1.12 (will be released in couple of weeks).
FirePicker adds a small color picker dialog when editing a CSS rule in Firebug. The addon scans for values that can be parsed as CSS colors and displays them in a drop-down list right below the firebug's CSS editor box. Clicking on the color value in the drop-down brings up a color picker dialog.

Read more...
Another Firebug extension we have tested with upcoming Firebug 1.12 (will be available in several weeks) allows managing web storage directly in your Firebug.
FireStorage Plus! appends an extra Firebug tab which lets you inspect and modify the local and session storage.

Read more...
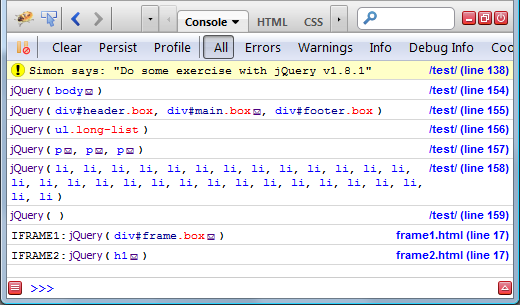
FireQuery is one of my favorite extensions for Firebug and I am regularly using it every time I am debugging web application that is build on top of jQuery.
FireQuery is a Firebug extension for jQuery development. It's a collection of Firebug enhancements for jQuery.
Read more...
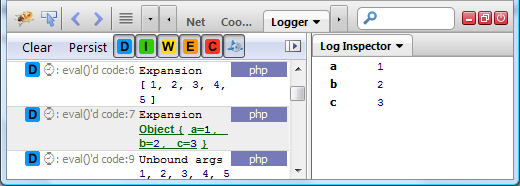
Another nice extension I would like to mention is related to server side logging: FireLogger
FireLogger implements simple yet powerful server side logging (similar to console.log on the client side). It creates a new panel (a logging console) in Firebug UI that displays logs coming from the server.
Logs are sent to the client side over HTTP headers. The extension supports PHP and Python scripts.
You can dowload it from AMO.
Read more...
There are many Firebug extensions implementing new nifty features for Firebug and its great to see that new ones are still coming.
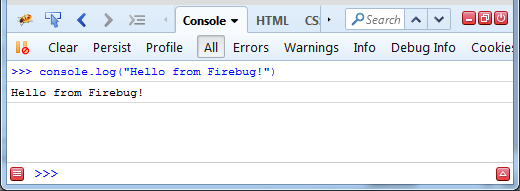
In this post, we'll take a quick look at one of them: Console Export.
ConsoleExport is a Firebug extension (you need Firebug 1.6+) that allows exporting logs from the Console panel. The export can be done manually through an Export button (see the screenshot below) or automatically by sending every log to the server.
Read more...
Firebug (and also Web Inspector) allows to label dynamically evaluated scripts using a special directive. The directive is a simple comment that is appended to the bottom of the evaluated script.
//@ sourceURL=foo.js
Such label is important especially for debuggers displaying list of scripts available on a page and so, developers can pick the right script see the source code and eventually create a breakpoint.
In order to avoid IE JS conditional compilation issues, Firebug will also support new syntax:
//# sourceURL=foo.js
This support will be available since Firebug 1.11.5 and Firebug 1.12 alpha 7
Syntax of the directive needs to match this regular expression:
/\/\/[@#]\ssourceURL=\s*(\S*?)\s*$/m;
See all Firebug tips
Read more...
Firebug 1.12 alpha 6 introduces one new feature called simply: Use in Command Line
This feature allows referring various page objects (HTML elements, JS objects, network requests, cookies, etc.) from within Firebug Command Line.
The user can also use object's properties in JS expressions.
See issue 6422 for more details.

This post explains the feature in detail and also asks for feedback.
Read more...


