
- Published:February 11th, 2011
- Comments:16 Comments
- Category:Extending Firebug Tutorial, Planet Mozilla
Firebug inspector is certainly one of the most valuable Firebug features and it also deserves more attention from extension developers. From this reason Firebug 1.7a10 introduces a new API that allows reusing this feature in Firebug extensions and customize its behavior.
This part of Firebug extension tutorial explains how to use this API in Firebug extensions.
Firebug Inspector
Let's see a quick overview of what is actually the Firebug inspector and how it works from the user perspective.
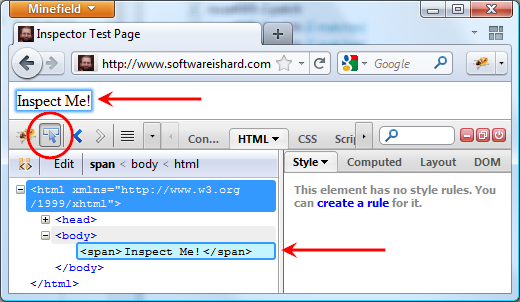
- Clicking on the inspector button starts an inspecting mode.
- As the user moves the mouse cursor over page elements, they are automatically highlighted.
- The HTML panel (selected by default) shows detailed information about the currently highlighted element.
- The inspecting mode can finished by clicking on the inspecting page element or canceled by pressing ESC key.
Inspector Listener
First simple option how to programatically watch the inspector in action is registering a listener and handle three events:
- onStartInspecting Called by the framework when the user starts inspecting.
- onInspectNode Called by the framework when inspecting is in progress and the user moves mouse over a new page element. This method is called in a timeout to avoid performance penalties when the user moves the mouse over the page elements too fast.
- onStopInspecting Called by the framework when the user stops inspecting.
{
onStartInspecting: function(context) {},
onInspectNode: function(context, node) {},
onStopInspecting: function(context, node, canceled) {}
};
Firebug.Inspector.addListener(inspectorListener);
context Context of the current page.
node Currently inspected page element.
canceled Set to true if the inspecting was canceled by pressing the Escape key.
Custom Inspector Panel
Another and more powerful method how to customize inspector's behavior is implementing a new panel that is used in the inspecting mode instead of the default HTML panel.
Let's imagine a simple example.
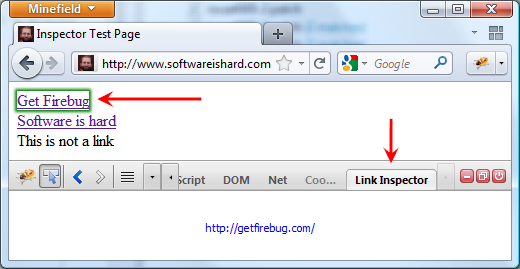
- There is a new Link Inspector panel
- If the user clicks the inspector button, Link Inspector panel stays selected.
- As the user inspects the page the panel displays own custom info about page elements (URL).
- Only
<a>can be inspected, the inspector ignores the other elements. - Green color is used to highlight a link to distinguish from the default inspector.
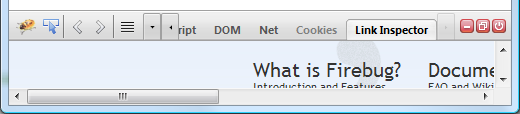
- If the user finishes inspecting by clicking on a link, the panel loads and displays the target URL.
You can install the extension and check out a test page. You can also get the source code.
Let's step by step go over the implementation. We need to define a new panel and register it.
LinkInspectorPanel.prototype = extend(Firebug.Panel,
{
name: "linkInspector",
title: "Link Inspector",
inspectable: true,
inspectHighlightColor: "green",
show: function(state) {
Firebug.Panel.show.apply(this, arguments);
LinkInspectorPlate.defaultContent.replace(
{}, this.panelNode);
},
startInspecting: function() {
LinkInspectorPlate.linkUrl.replace(
{object: node}, this.panelNode);
},
inspectNode: function(node) {
return false;
},
stopInspecting: function(node, canceled) {
if (canceled || node.href.indexOf("http") != 0)
return;
LinkInspectorPlate.linkPreview.replace(
{object: node}, this.panelNode);
},
supportsObject: function(object, type) {
if (object instanceof Element) {
if (object.tagName.toLowerCase() == "a")
return 1;
}
return 0;
},
});
Firebug.registerPanel(LinkInspectorPanel);
There is a few things to note:
- The panel has an
inspectablemember set to true. This ensures that the panel is used for inspecting (if the user starts the inspector mode while having this panel selected) and the framework calls inspector related methods on it. - The pane has an
inspectHighlightColormember set to green. This is how the highlighter's color is customized. - The panel implements/overrides three methods:
startInspecting,inspectNodeandstopInspecting. These methods have the same meaning as in case of the listener. inspectNodedisables default selection mechanism (used e.g. by the HTML panel) by returning false. In this example, the method redraws panel content every time a new link is being inspected (using a Domplate template, see below).stopInspectingis executed when the user finishes the inspecting mode. In this example, it's purpose is to load/preview the target page. This is again done using a Domplate template and only if the inspection wasn't canceled.- The panel implements a
supportsObjectmethod that is used to specify whether given node should be inspectable. - Finally, the panel also implements
showmethod that renders default panel's content.
Here is the Domplate template:
{
defaultContent:
DIV({"class": "defaultContent"},
"Use Firebug Inspector and try to inspect a link on the page."
)
linkUrl:
DIV({"class": "linkUrl"},
"$object.href"
),
linkPreview:
IFRAME({"class": "linkPreview", "src": "$object.href"}),
});
defaultContentDefault content of the panel rendered in show method.linkUrlDisplays URL of the inspected link.linkPreviewAn IFRAME that loads the target page.
Table Inspector
Let's see yet one example that reimplements supportsObject method in order to only inspect tables.
{
if (object instanceof Element) {
if (object.tagName.toLowerCase() == "table")
return 1;
}
return 0;
},
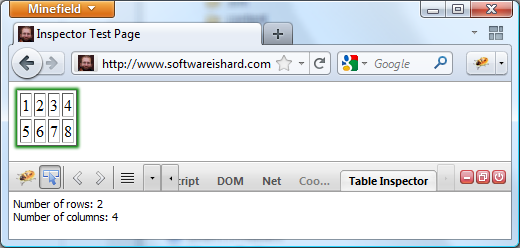
This inspector ignores the entire inner structure of a table and focuses only on the <table> element. The content of the panel is consequently displaying only properties that are typical for tables.
I believe that Inspector API can encourage extension developers to create library specific inspectors that focus on complex page widgets instead of HTML markup (which is already done in the HTML panel anyway). You can see Illuminations for ExtJS as an example.
Please, let me know if you have any ideas about new inspector related features that could be implemented or if you have any ideas how the API could be yet improved!


16 Comments
I should point out that we have also added a feature that allows you to highlight more than one area at once. This means that it is very simple to outline the table in one color and each of the tables cells in another color.
[...] tutorial – http://www.softwareishard.com [...]
[...] Software is hard | Extending Firebug, Inspector (part X.) [...]
Is there any highlight methods? I mean using Fb Inspector highlighting at own extension.
@Antonio Banderas: I don't understand the question, please provide more information about what you want to do.
[...] tutorial – http://www.softwareishard.com [...]
[...] Software is hard | Extending Firebug, Inspector (part X.) [...]
[...] New API for Firebug extensions [...]
[...] NewAPI for Firebug extensions [...]
[...] New API for Firebug extensions [...]
[...] API for reusing Firebug Inspector in other [...]
[...] New API for Firebug extensions [...]
[...] New API for Firebug extensions [...]
[...] API for reusing Firebug Inspector in other [...]
Hey.. can't get this example-code running. just updated helloworld.js with the "custom inspector panel" - code, but theres no panel in firebug...
[...] New API for Firebug extensions [...]