Firebug's Net panel is well known and indispensable tool for debugging and testing page load performance. Its purpose is to provide detailed timing information about HTTP traffic initiated by a web page.
Also, all data collected by the Net panel can be exported into a HAR file and processed by other tools (e.g. you can use online viewer for preview).
Finally, it's also possible to automate the entire page-load-test-and-export process using Selenium. So, if it sounds interesting to you read more about how to setup Firebug, NetExport and Selenium to automatically measure performance of your site!
Read more...
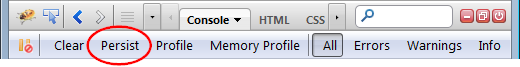
The Persist feature has been available in Firebug for some time already, but I recently got several questions indicating that it doesn't have the visibility it deserves. So, let's introduce it quickly.
Firebug UI resets every time the current browser tab is refreshed or navigated to another page - to show the new state. The consequence is that all Firebug panels trash the content (i.e. the Net or Console panel entries are lost).
This is fine since usually the user doesn't want to keep the entire history. But what in the case when you want to debug the transition process between page loads or redirects?
And this is exactly when the Persist button becomes practical...
See all Firebug tips
Read more...
Firebug 1.8b3 introduces a new API that can be used to create time-stamps during Javascript execution and compare them together with HTTP traffic timing on the timeline in the Net panel: console.timeStamp();
This feature is useful in cases where the developer needs to know when particular piece of Javascript code is executed relatively to the HTTP request made by web page. Especially in cases when Javascript is loaded through dynamically appended <script> tags or through XHR and evaluated using eval().
See the following screenshot that shows a time-stamp generated during a page load.
The time stamp is also displayed in the Console panel so, you can compare with other logs.
The rest of this post demonstrates this feature on couple of live examples in detail. So, if you are interested what you can do with Firebug 1.8, read further!
Read more...
I have been recently working with Sergey Chernyshev, who is the author of ShowSlow, on a new support for uploading HTTP tracing data (collected by the Net panel in Firebug) to the ShowSlow server.
This neat feature simply allows to upload the data in HAR format to the server and share them with others online.
Note that similar thing (uploading and sharing of measured data) is also supported by YSlow and PageSpeed (also using ShowSlow).
Another good news is that ShowSlow is an open source (I love open source!) and so, if you want to keep your data private while having the advantage of simple sharing (and other nice ShowSlow fetures), you can download and install your own copy of ShowSlow server (and also avoid limited upload history on the public instance).
So, read more if you are interested.
Read more...
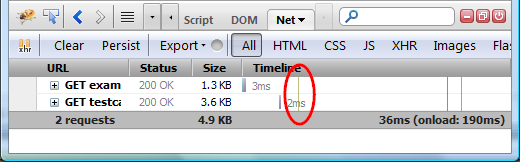
Page load performance is largely important topic these days and virtually touches every web developer. In this post, I am going to show several page-load cases and describe how to properly read (analyze) data provided by the Net panel in Firebug.
Just to quickly summarize, the purpose of the Net panel is to intercept network communication between a web-page and the server and see what's going on under the hood. All created reports (logs) can be exported by NetExport extension (in HAR format) and there is also an online viewer allowing to preview all exported logs in graphical form.
In order to put together all following examples (HTTP activity logs) I used:
Firefox 3.6 + Firebug 1.5 + NetExport 0.7.
This post is also translated into Japanese.
Read more...
We have been working with Simon Perkins and Steve Souders on an open format for exporting HTTP tracing information. It's called HTTP Archive (HAR) and we have just finished spec v1.1.
The format is already supported by Firebug (with NetExport extension installed), HTTPWatch 6.2 and also DebugBar 5.3. Further tools like Show Slow and Cesium could be the next.
The key idea is to have a common format for archiving HTTP information that are captured by HTTP sniffers. These logs contain valuable info about page load performance and can be further used to analyze and optimize weaknesses of the monitored page.
There is already a few blog posts about this, explaining all details and so, let me just summarize the most important links here.
Links
HAR Specification
HAR Discussion Group (first post moderated)
HAR Viewer Online preview of *.har files.
NetExport Firebug Extension for exporting HTTP logs.
Recommended Firebug Configuration: Firebug 1.5a26+, NetExport 0.7b5

About a month ago, I wrote a post introducing a HTTP Archive format that is used to export data from Firebug's Net panel.
Since that time we have made further progress and following info could be useful for all who are dealing with HTTP tracing logs and page load performance.
- NetExport - (requires Firebug 1.4a26 and higher) an extension that allows exporting HTTP tracing data from Firebug. This extension appends a new Export button into Firebug's Net panel toolbar (see the screenshot bellow).
- HTTP Archive Viewer - online tool that allows previewing of existing logs. The viewer uses the same visual style for visualizing HTTP tracing data as the Net panel. Note that it's possible to compare tracing info generated by multiple pages (which is also something what is planned for Firebug 1.5)
- HTTP Archive Format - description of the format for exported data (doc updated according to feedback we've got).
NetExport
HTTP Archive Viewer


