One of the improvements in Firebug 1.6b3 is better design for the Stack side panel that is available if the debugger is hanging e.g. on a breakpoint, displaying list of function calls that are currently on the stack.
Reported as issue 3520.
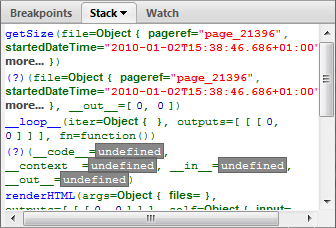
A picture is worth a thousand words (especially in this case) and so, see how the panel looks in good old Firebug 1.5.

Each function call is represented by a function name followed by a list of arguments. The mess here is caused by spreading this info over more lines. The result: it's hard to distinguish individual frames.
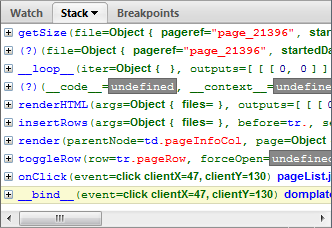
Here is how we redesigned it for Firebug 1.6:

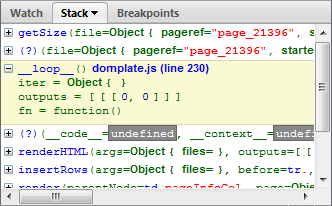
Only one function call per line. Yes, this means there is usually a horizontal scroll bar, but the user can expand each function to see list of all arguments without scrolling. See the next screen-shot.

Thanks to Steven Roussey and Sebastian Zartner for the input they had when implementing this!
Any other ideas how this could be yet improved?
What would you expect to see in a tooltip (if any)?
Here is a brief tip post about the well known Firebug's inspector feature and its integration with the command line.
You need Firebug 1.7a4 that fixes a bug in command line APIs (the fix will be ported into 1.6b3)

When the inspector is used to inspect the current page, Firebug is automatically keeping a history of recent inspected elements. The history is consequently accessible in the command line through following command line APIs.
$0 The currently selected object in the inspector.$1 The previously selected object in the inspector.$n(index) Access to an array of last 5 inspected elements.
See all Firebug tips
So, you can use $0 as a variable pointing to the currently inspected element and pass it to another functions or access it's properties.
For example, right click on the above screen-shot and pick Inspect Element. Switch to the Console panel and use $0 in the command line to get number of attributes.

jQuery in the command line
Here is another example that uses jQuery APIs in the command line. The $0 element is passed into the jQuery function as a parameter (slideUp method animates the height of the element).

If the current page doesn't use jQuery, you can install it quickly using a jQuerify bookmarklet.
Many things are happening in the Firebug universe every day and there are several channels you can follow to make sure you don't miss anything what matters to you.
I believe it deserves at least this little post to summarize the most important of them and provide a short description so, one can decide what is the most appropriate source of information to follow.
- getfirebug.com Of course, this site is the real center of Firebug universe. It accumulates all about Firebug.
- Firebug Blog The official Firebug blog is (among other things) broadcasting news about every released Firebug version, describing changes and fixed bugs.
- @firebugnews Are you consuming all news via Twitter? Then follow us there! Firebugnews channel is listening and (re)tweeting about things that are interesting for Firebug users and developers.
- Newsgroup Are you a Firebug contributor and/or Firebug extension developer? Then being member of this group is essential.
- Firebug Wiki Wiki is not real news channel, but I couldn't miss it in this list since it's simply the best source of information about Firebug features and internals.
Other Firebug Links.
Finally, you can also follow this blog.
