- Published:October 19th, 2012
- Comments:6 Comments
- Category:Firebug, Planet Mozilla, Release
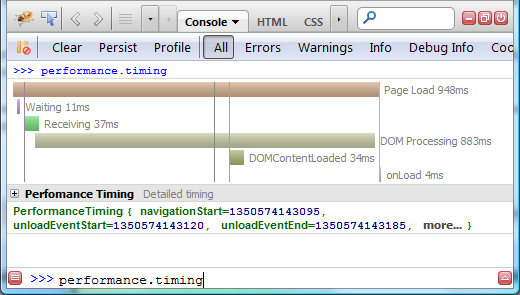
One of the new features introduced in Firebug 1.11 alpha 5 is new waterfall timing graph displayed in Firebug's Console panel and visualizing Navigation Timing data (measured events related to page load performance).
You can see the graph if you execute performance.timing expression in Firebug command line.
From MDN:
The Navigation Timing API provides data that can be used to measure the performance of a website. Unlike other JavaScript-based mechanisms that have been for the same purpose this API can provide end-to-end latency data that can be more useful and accurate.


