- Published:October 19th, 2012
- Comments:6 Comments
- Category:Firebug, Planet Mozilla, Release
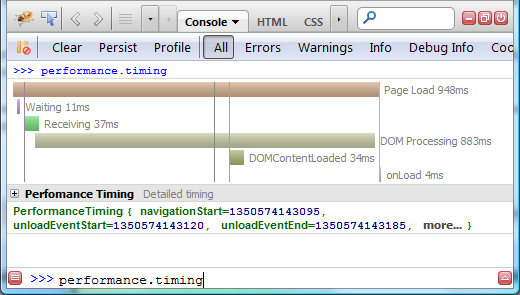
One of the new features introduced in Firebug 1.11 alpha 5 is new waterfall timing graph displayed in Firebug's Console panel and visualizing Navigation Timing data (measured events related to page load performance).
You can see the graph if you execute performance.timing expression in Firebug command line.
From MDN:
The Navigation Timing API provides data that can be used to measure the performance of a website. Unlike other JavaScript-based mechanisms that have been for the same purpose this API can provide end-to-end latency data that can be more useful and accurate.

Page Load 948msTime needed to load the page (from navigationStart to loadEventEnd).Waiting 11msWaiting for response time (from requestStart to responseStart)Receiving 37msTime needed to download the response (from responseStart to responseEnd)DOM Processing 883 msTime needed to build DOM (from responseEnd to loadEventStartDOMContentLoaded 34msTime needed to handle DOMContentLoaded event (from domContentLoadedEventStart to domContentLoadedEventEnd)onLoad 4msTime needed to handle onLoad event (from loadEventStart to loadEventEnd)
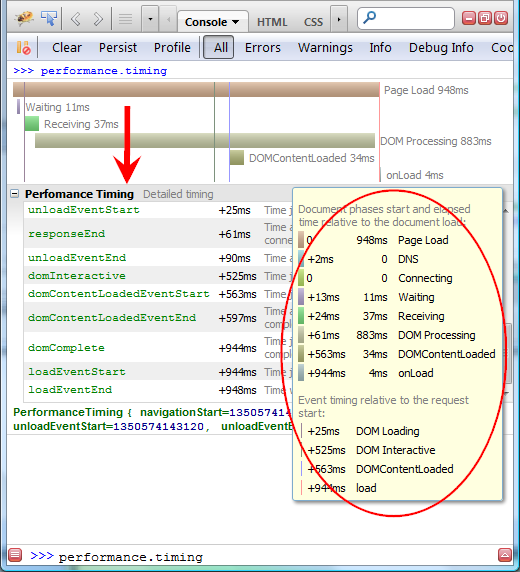
Some events are visualized using vertical lines on the graph. If you need detailed info about what they represent hover mouse over the graph and check the info tip.

The screenshot also indicates that Performance Timing (Detailed Timing) section is expandable providing detailed information about all events, relative time since the page load beginning and also short description for every individual event.
You can hover mouse over individual entries in this table and see appropriate vertical line dynamically rendered over the waterfall graph to show when exactly the event happened.
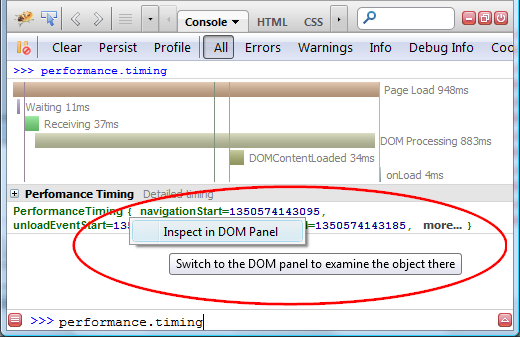
If you want to inspect the original values stored in window.performance.timing object, right click on the green object-log at the bottom and pick Inspect in DOM Panel from the context menu.

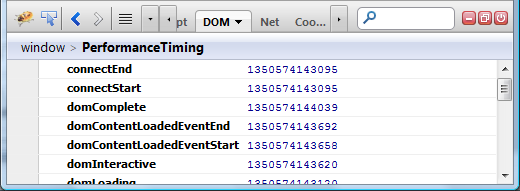
You should be navigated to the DOM panel and see all the values as they are exposed to the page.

Note that data displayed by the Net panel are collected by Firebug while data stored within performance.timing object are collected by the browser itself.
Do you have any tips how to improve this feature?


6 Comments
[...] detailed post about this [...]
I just tried it, it's very nice. This feature may be hard to discover however.
I like this new feature a lot. It quickly gives an overview of the page's loading performance.
> Do you have any tips how to improve this feature?
Yes. Sorry that I didn't tell them to you earlier.
1. Put the graph into the group.
2. Do we need the object in the log? Isn't the context menu option enough?
3. Change the formatting of the timing part names. They are not clickable, so they shouldn't look like links. Though there should be a hover effect of the whole line.
4. Choosing "Inspect in DOM panel" from the context menu of the table should show the performance.timing object, not a Firebug internal one.
Sebastian
nice feature.
would be great to see the actual url which the graph depicts in the console.
[...] Aby wyświetlić ten wykres, należy wykonać w konsoli polecenie performance.timing. Szczegółowy opis tej funkcji można znaleźć tutaj. [...]
[...] detailed description of this [...]