
FBTrace Console
by Honza- Published:May 15th, 2008
- Comments:6 Comments
- Category:Firebug
I have already mentioned a few times how useful is FBTrace (made by John J. Barton) for debugging Firebug. So, for those who are interested how Firebug works internally, it's something I would definitely recommend to use.
As the name indicates, FBTrace represents support for tracing within Firebug, notice that it isn't part of the release version of Firebug. So, if you would like to try it out, you have to download a version that includes tracing support from public SVN repository. See this readme.txt for more details about individual branches.
At the present, I would recommend to use branch Firebug 1.2 (or download beta with tracing here) as it's currently the version under development.
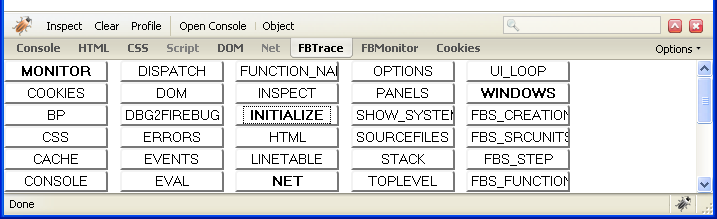
If you have managed to successfully install Firebug with tracing support, you should see a new panel called FBTrace. This panel shows many options (you can see them in the Options menu too) that represent various areas in Firebug internal framework. If you want to see some log messages related to a specific area, just click appropriate option (it's bold if it's on) and refresh the current page (or restart Firefox) - depends on specific option. Now, Firebug should print bunch of log messages into the system console window.
In order to see the system console, don't forget to launch Firefox with -console option on the command line.
I am using the console quite often (sometimes it's only the way how to track down what is actually happening) and I have soon realized how much I am missing the following:
- Quickly find out where is the piece of code that prints the message.
- Search within all messages whether specific log is there.
- Put a separator at the end of the list.
- Clear the log.
A few weeks ago, I couldn't resist and I have written down a simple replacement of the tedious and black system console. The new console is based on domplate - quite powerful UI template system in Firebug (I'll write something about this too) - it intercepts FBTrace's logs and displays it in more readable way.
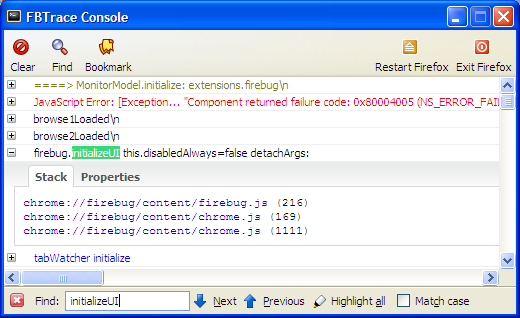
Every message is expandable so, you can see additional information. E.g. there is a stack trace for each log (you can click it and see the source code).
There are also some actions available in the toolbar.
- Clear - removes all messages from the log.
- Find - displays standard find bar at the bottom of the window.
- Bookmark - puts a separator at the end of the list.
- Restart Firefox
- Exit Firefox
All these simple features helped me a lot. I haven't spent much time on testing (used with: WinXP, FF3, FB 1.2) as it's done mainly for my personal usage. But, if you want to explore more how Firebug's code works and you think this could help, download the new trace-console from here.
If it turns out to be really useful, it could be perhaps core part of the FBTrace in the future.
Enjoy!


6 Comments
I've been using this for the past couple of days and I have to say it is much nicer than looking at a terminal window.
Will this be updated to work with FF 3.0.1?
How can I turn this feature off?
FBTrace console is part of Firebug builds marked with "X" (versions with tracing enabled). If you don't need it, just install an end-user version. See more info here: http://getfirebug.com/releases/
Very useful tool!
what can i do to fix my credit...
I only wish I had found it sooner....