
Tracing Console for Firebug
by Honza- Published:October 11th, 2008
- Comments:10 Comments
- Category:Firebug, Planet Mozilla
I wrote a post about my FBTrace Console extension a few months ago and as it turned out that the console is actually quite useful for exploring how Firebug works internally, it's part of the Firebug's code base now.
This new feature is integrated in Firebug 1.3X (still in alpha phase), where X means: the version with tracing enabled.
The primary purpose of the console is to display a list of tracing messages coming from Firebug as it runs. It's often tough to debug a debugger by another debugger and so, having the possibility to inspect logs is often really invaluable.
Notice that tracing-console is *not* the same as Firebug's Console panel. Console panel is intended to be used by web applications developers, while tracing console is for Firebug (or Firebug extension) developers.
So, move on if you want to see how it works...
Tracing Console Features
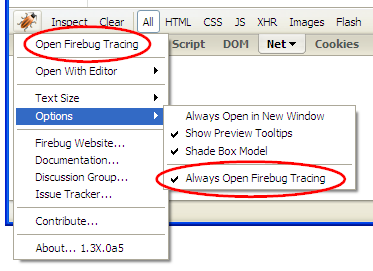
First, there is a new menu item in Firebug (again, only in X version) that is used to open the tracing console window. There is also a new option, which can be used to open it automatically when Firebug starts.
This is how it looks like in Firebug 1.3X
...and in Firebug 1.5X

The name of the underlying auto-open preference (boolean) is:
As soon as the console window is opened it should look like as follows:
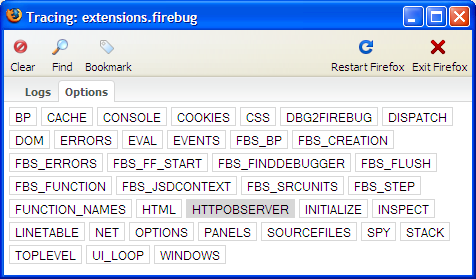
There are some handy toolbar buttons that make possible to remove all logs (Clear), open Find bar to search for words or phrases (Find), put a separator into the list (Bookmark) and finally exit or restart Firefox.
You can also see two tabs. Logs tab is intended to display list of all logs and Options tab is used to specify, which kind of logs should be collected. You can select an option by clicking on it. For example, if you select NET option, you'll see all logs related to Firebug's Net panel activity. Every option is associated with a preference (in the Firefox user profile), so your selection is persistent.
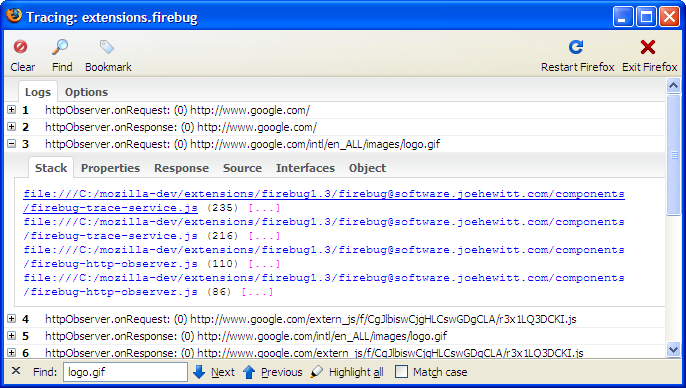
Every trace-message (log) in the trace console can be expanded by a mouse click in order to see more information. There is always (at least) a Stack tab so, you can quickly find out where the message is coming from. In case you are running Chromebug (made by John J. Barton), clicking on the stack-frame opens Chromebug with the source file scrolled automatically to the proper line. You can also use Chromebug to inspect objects displayed by the tracing console. All is nicely linked together: Firebug, Chromebug and Tracing Console (however still alpha phase).
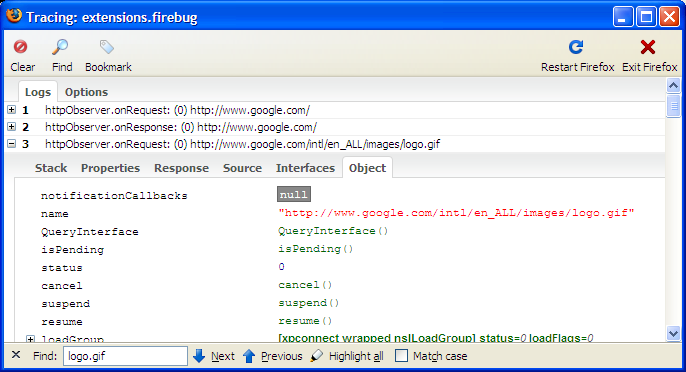
If a trace-message is associated with an object (which is often the case), there are additional tabs displayed (depends on object's type) so, you can see e.g. all its properties, implemented interfaces etc.
How to use it from another extension
Firebug tracing-console is also ready to be used from another extensions. So, if you are developing a Firebug (or just Firefox) extension, you can log information also from your code. It's simple, see the following guide.
First, you have to specify a group of your logs. This group will be displayed within the Options tab so, you'll be able to switch on/off your tracing (just like the other options). The underlying preference value is updated accordingly.
In order to setup your own group/option, you just have to create a new boolean preference. If you are tracing a lot from your code, it's useful to create more options. This helps to filter out the output list of log messages.
pref("extensions.firecookie.DBG_COOKIES2", false);
Notice that your preference should be created within your extension's preference domain (e.g. extensions.firecookie). The preference name (the part after the last dot) must begin with DBG_.
Now, you have to get reference to a firebug tracer object that is used to log messages. Use your extension's preference domain as a parameter for getTrace method (extensions.firecookie in the following example).
.getService(Components.interfaces.nsISupports)
.wrappedJSObject.getTracer("extensions.firecookie");
Finally if you want to trace, use following code:
if (FBTrace.DBG_COOKIES)
FBTrace.sysout("Text message from Firecookie!");
// Log also an object.
if (FBTrace.DBG_COOKIES)
FBTrace.sysout("Trace info about a cookie object", cookie);
// We can also use another option/group.
if (FBTrace.DBG_COOKIES2)
FBTrace.sysout("Another trace message");
The FBTrace.DBG_COOKIES and FBTrace.DBG_COOKIES2 properties are automatically set as you enable/disable them in the Options tab.
Finally, since both preferences (DBG_COOKIES and DBG_COOKIES2) use its own pref domain (extensions.firecookie), you have to also open a new console window for that domain (this can be done e.g. within initialize method of your model object). This window will display all messages (and options) from the domain.
Firebug.TraceModule.openConsole("extensions.tracing");
Notice that you need Firebug 1.4a7 (or Firebug1.3b4) that fixes a bug within openConsole method.
Here is an example that shows how to open a new console window for specific domain and also how to customize log messages using CSS.


10 Comments
Very interesting. And I'm sure very useful for Firebug extension authors.
In the last paragraph, "The FBTrace.DBG_COOKIES and FBTrace.DBG_COOKIES properties" - I think the 2nd "DBG_COOKIES" should be "DBG_COOKIES2".
Yep, you right, fixed. Thanks!
Honza
I think it will be very useful (bookmarked for future testing).
Thanks! Your tutorials and tools have realy helped me understanding Firebug
Thanks, this will prove to be extremely useful, as are the other tutorials!
The only way I could get this to work though was to specify the option preference in the firebug preference domain rather than in my own extension's domain (e.g. extensions.firebug.DBG_COOKIES rather than extensions.firecookie.DBG_COOKIES). I discovered this when looking at the firecookie code after I couldn't figure out why my tracing option didn't show up.
@Hans: you right, this is also correct. Thanks for pointing this out! I forgot to mention that if you using a new pref domain (e.g. extensions.firecookie) you have to also open a new tracing-window for that domain. I have updated the post (see the addition at the bottom + an example).
The more I am using the tracing-console, the more I think that better would be to have a possibility to specify more pref-domains for single console-window. It's a bit annoying having bunch of console windows on the screen.
Another useful tool!
and in
--------------------------------------------------
if (FBTrace.DGB_COOKIES)
FBTrace.sysout("Text message from Firecookie!"); -----------------------------------------------------
I guess 'DGB' should be 'DBG':)
I was confuse that why "you have to also open a new console window for that domain" before I read the comment #5 and comment #6.
Thanks for your sharing!
@wcw: Ah, you right, thanks, fixed.
Hi!
Great tutorial!
I am developing a firefox extension, unrelated to firebug, and would like to open a tracing console.
However, I do not overlay the firebug xul, and do not have access to the Firebug object. Can I run openConsole through Components.classes ?
Thanks,
Udi
@Udi: No, but Firebug object is global in chrome space so, if your extension is overlaying browser.xul you should be able to use Firebug.TraceModule.openConsole.