One of the new improvements introduced in Firebug 1.11 beta 1 is better monitoring of messages sent between frames/windows. These messages are sent via window.postMessage.
Couple of quick notes about window.postMessage:
- It enables cross-origin communication.
- It places a message in the message queue associated with the thread that created the specified window and returns without waiting for the thread to process the message.
See all Firebug tips
Read more...
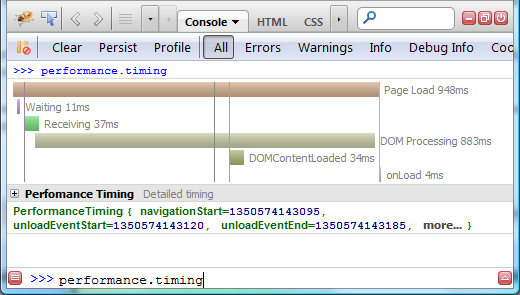
One of the new features introduced in Firebug 1.11 alpha 5 is new waterfall timing graph displayed in Firebug's Console panel and visualizing Navigation Timing data (measured events related to page load performance).
You can see the graph if you execute performance.timing expression in Firebug command line.
From MDN:
The Navigation Timing API provides data that can be used to measure the performance of a website. Unlike other JavaScript-based mechanisms that have been for the same purpose this API can provide end-to-end latency data that can be more useful and accurate.

Read more...
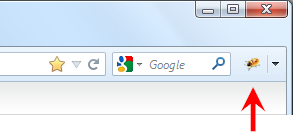
The Firebug entry point and also the only Firebug UI visible immediately after installation is s Firebug button (icon) placed at the right side of the navigation Firefox toolbar.

This button is called Firebug Start Button and its main purpose is to open Firebug UI by clicking on it (you can also use F12 key to open Firebug) but, the button does much more than just opening Firebug...
See all Firebug tips
Read more...
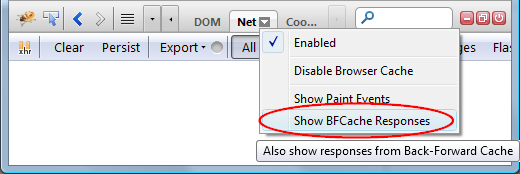
Firebug's Net panel offers an option called Show BFCache Responses that allows tracking also responses coming from BFCache. But what the heck is this cache for?
Read this post to understand how this cache is different from the standard browser cache and why Firebug supports it.

See all Firebug tips
Read more...
Updated: how to use this feature from the command line
Have you ever placed console.log into a JS function just to figure out whether the function has been executed? Did you also happen to make a syntax error when doing that code modification? 😉
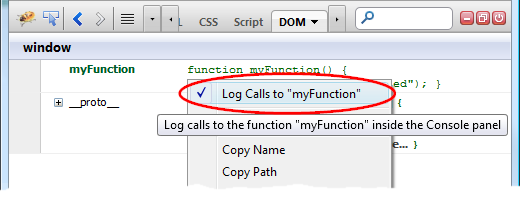
Then you could be interested in Firebug feature that allows to log function calls without changing the code!
This feature is ready behind a Log Calls To ... menu item that is available if you right click on a function link (e.g. in the DOM panel).

See all Firebug tips
Read more...
Updated: how to use this feature from the command line
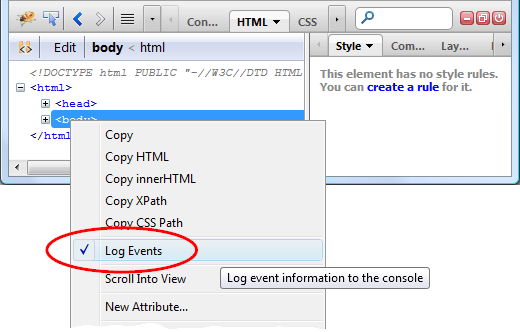
This Firebug feature is called simply Log Events and allows developers to log DOM events into the Console panel.
All you need to do is right click on an element in the HTML panel, pick Log Events from the context menu and switch to the Console panel to see the logs in action.

See all Firebug tips
Read more...
Firebug is mainly a debugger and being able to stop Javascript execution on a breakpoint is obviously one of its essential features.
Also, ability to break on a breakpoint only if certain condition is true is useful feature and so, check out this post if you are interested how to properly create a conditional breakpoint in Firebug.
This post covers three types of conditional breakpoints.
- Javascript Breakpoint
- XHR Breakpoint
- Cookie Breakpoint
See all Firebug tips
Read more...
Firebug is a tool for web developers and its features like JavaScript debugging and HTML/CSS inspection are well known, but there are also many little features users often don't know and so, they deserve more publicity.
One set of such features is related to XML and I'd like to describe them in this post. So, let's see what Firebug offers to developers who deal with XML!
- XML Posted Over HTTP
- XML in HTTP Response Bodies
- XML in Cookies
- XML Logging
- Query XML Documents
See all Firebug tips
Read more...
Break on HTML mutation feature has been introduced in an article Dynamic and Graphical Web Page Breakpoints submitted to WWW 2010.
This feature is great for exploring and learning an existing code that is dealing with HTML/UI. It allows the Firebug user to break JavaScript execution when various HTML mutation events happen and see the line of code that caused that event.

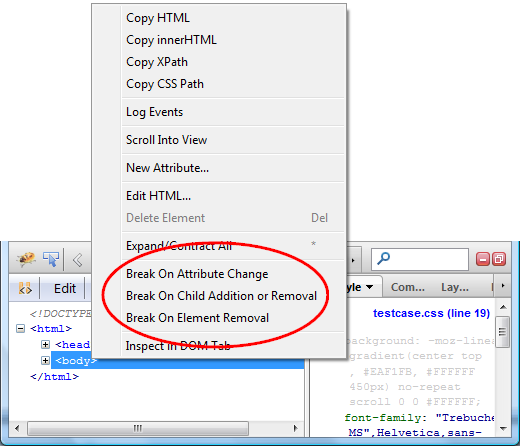
There are three types of mutation events.
- Break On Attribute Change
- Break On Child Addition or Removal
- Break On Element Removal
Let's go over three simple examples that explain how to use the feature and how it can be useful to web developers. Each example is available live on this page and so, you can just open Firebug UI (or install Firebug) and try it out immediately.
See all Firebug tips
Read more...
Firebug 1.10 has been released today and one of the new features introduced in this version is called Trace Styles.
This feature allows tracing all places which affected specific CSS property, whether explicitly or by inheritance. The list also shows which property is actually applied.
This feature is integrated into the Computed side panel (available within the HTML panel) where every CSS property is expandable.
Of course, you need Firebug 1.10+ to try out this feature.
See all Firebug tips
Read more...

