I couldn't find a better label for a fix that landed in the latest Firebug 1.7 (and will be backported into 1.6), but I am sure that a few Firebug screenshots will clarify it well enough.
The bug has been reported for some time and it's related to panels that display breadcrumbs.
Here is what these breadcrumbs mean in context of a panel.
- HTML displays XPath for the selected element.
- Script shows the stack trace when hanging on a breakpoint.
- DOM displays the position of the selected object within DOM hierarchy.
The problem appeared when the breadcrumb information was so long that it went off the screen. Here is an example of the Script panel with long stack trace.
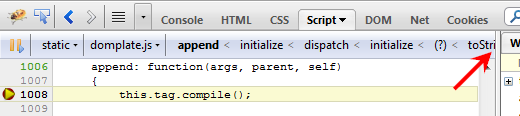
See, the stack trace even pushed the debugger buttons of the panel and it's only possible to debug using keyboard.
Here is the fixed version.
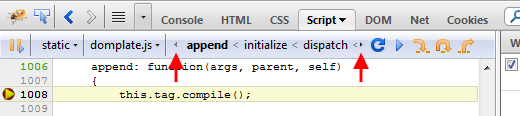
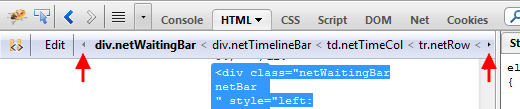
The HTML (and DOM) panel is also fixed, in case of a deep hierarchy of elements (and long XPath) there are, again, a little arrow buttons that allow to scroll and see the entire value.
Note that scrolling can be done by:
- clicking on the small arrow
- moving mouse over the small arrow
- using mouse wheel
- using keyboard (you need to check Enable Accessibility Enhancements in Firebug options)
We have been working on version 1.6 since the end of January this year and after twenty alpha releases we have first beta!
Switching into the beta phase means a few things for Firebug 1.6 users and developers:
- Feature freeze. No new features for 1.6, we are now only fixing bugs, improving stability and compatibility with Firefox 4.0
- Firebug 1.7 (alpha) branch has been created and all contributors and active developers are switching to it. Any new ideas and features belongs into this branch.
- We appreciate feedback from beta users! Please, let us know about any problems in the newsgroup or file a bug (there are Firefox 4.0 known issues).
- If you are a translator, please help us to get rest of the strings done. Firebug locales are managed on Babelzilla.
John J. Barton already put together a list of new features on getfirebug.com blog, but it's too awesome so, let me repeat that and add a little descriptions.
- Back and Forward arrows in the toolbar Have you ever wanted to just quickly switch to the previous Firebug panel - or to a previous file displayed within the Script panel? Now, you can just click back...
- Scrolling Panels Tab Bar Do you have a bunch of Firebug extensions installed and there is not enough space for all the panel-tabs? This problem is now solved by scrolling.
- Command line available on all panels Firebug command line is one of the strongest features and so, it's now possible to use it from any panel. So, for example, you can evaluate an expression while hanging out at a breakpoint in the Script panel.
- Implemented console.table New method for well known console object that allows to log various data structures using tabular format. Not only the layout is useful, but you can also sort by columns.
- Disabling break on next error When Firebug debugger hits a debugger; keyword on the page, it breaks the current execution (it works like a breakpoint in the source code). The news is that you can temporarily disable it using disabled breakpoint (a breakpoint with condition set to false).
- MozAfterPaint events Painting events can be tracked by the Net panel and displayed on the graphical timeline together with all the other events and HTTP requests.
- Net panel reports BFCache hits In order to make back/forward (BF) browsing and startup fast, Firefox uses a cache (note that it isn't the HTTP cache). Firebug now reports also reads coming from this cache.
- Option to use en-US locale Firebug UI can be switched into the default en-US locale even if Firefox uses different locale. Useful for developers who use localized Firefox but want Firebug in English.
- First Run Page A first run page is now displayed after an install or update. We want to keep you updated through this page.
- Testbot results Results from automated test-bot are continuously displayed on getfirebug.com. Anybody can run automated Firebug test suite and upload results to that page (so we can see that even rare configurations work).
- Console Filtering The Console panel allows to filter its content using a toolbar buttons. You can filter by: error, warning, info, debug or display all logs at once.
We have also fixed many bugs, compatibility issues, memory leaks and I see Firebug 1.6 as the best version ever.
Firebug 1.6 is slowly approaching a beta phase and one of the last features we have put in a18 is related to localization. Note that Firebug is currently using more than 500 strings in its UI and these are translated into approximately 40 languages.
Even if we are always planning a string freeze in order to give Firebug translators some time to process new strings, we often end up with a few unfinished locales.
This is a problem especially for DTD entities since missing entity causes fatal error and in case of Firebug - not loading the extension at all (XUL overlay is not loaded). The problem is not that critical if the missing string comes from a *.properties file, since these are scriptable and we can handle the missing-string-exception in Javascript. The only issue is what to display in the UI instead.
From these reasons we decided to do following:
- Don't use DTD entities
- Use en-US as fallback locale (for missing strings)
And as a bonus (!), these changes allowed to fix Issue 907: Option to use en-US locale instead of fx default locale
So, all you need to do to always use Firebug with en-US locale, is to set
extensions.firebug.useDefaultLocale
preference to true. There is no UI in Firebug for this option and so, you need to use about:config (see all prefs in Firebug).
Do you think this should be available in Firebug->Options menu?
Read further, if you interested how we implemented that.
Read more...
Another new feature that made it into Firebug 1.6a14 (available later today) is tracking HTTP responses coming directly from Firefox BFCache (back/forward cache) and displaying them within the Net panel.
The purpose of this cache (note that this is different from the standard HTTP cache) is to make navigation in the browser history fast.
The consequence of using the BFCache is that there is no HTTP activity (that's why it's fast) and so, till now these requests wasn't displayed in the Net panel.
While I think it was actually correct (since purpose of the Net panel is to monitor HTTP activity), it was confusing sometimes as the Net pane was empty even if it was quite obvious that there need to be some requests.
So, the feature is optional (on by default).

All responses coming from the BFCache are displayed in gray. See the next screen-shot that shows what happened when I pressed the Back button.

One thing I am still not sure about is whether the gray color is enough to distinguish BFCache responses from regular HTTP responses...
Another way how to differentiate these two different responses is depicted here (just a mock-up):

BFCache response could be hidden behind an extra entry that clearly depicts that it's BFCache related. This would make the Timeline column a bit hard to read since there would be empty rows in the waterfall diagram, but perhaps nobody is interested in that if it doesn't come from the server and there is not HTTP communication anyway.
What do you think?
Any tips how to cut the Gordian knot?
One of the new features introduced in Firebug 1.6a14 (will be available later today) is a possibility to use the command line also from other panels (not only from the Console panel).
This feature has been requested for a long time and since the command line is one of the most important parts of Firebug, we decided to jump on this and ship the support yet with Firebug 1.6.
As usual let's see how this feature looks like from the UI perspective.

In this particular case, Firebug is opened in a new window (detached), but the same works also for Firebug displayed at the bottom of a browser window (attached).
You can see a few new things:
- There is a new button in the Firebug toolbar. This one is used to show/hide the command line.
- The Script panel is now selected.
- And voilà, here is the Command line!
The screenshot also indicates usage of the command line during debugging. When the Javascript execution is stopped at a breakpoint, the user can use the command line for expression/variable evaluation. In some cases it's faster than using the watch window, especially if you want to see the result just temporarily and don't want to create an extra entry in the Watch window (which would have to be removed later).
Visibility of the command line can be also controlled by a keyboard shortcut. If it's opened and the user presses the Escape key, it's closed, second snap on the same key opens it again.
I believe that this feature opens the door for further improvements, like for example drag and drop of the selected text from e.g. the Script panel into the command line for auto-evaluation.
Please if you have any tips how this feature could be yet improved, post a comment here or follow up in the news group, thanks!
Another feature introduced in Firebug 1.6a11 is support for back and forward navigation. This well known pattern used in all web browsers to navigate among visited web pages turned out to be quite useful for Firebug too.
See how the related UI looks like.
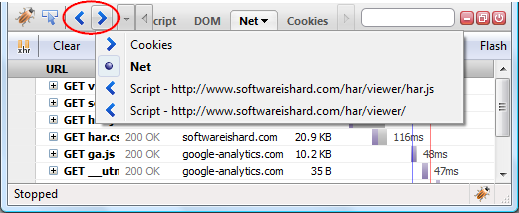
As expected, there are two buttons: Back and Forward, these are used to move within the history of visited Firebug panels. Right click on these buttons opens a pop-up menu with recent history entries.
In this particular case (on the screenshot), the history shows that Cookies, Net and Script panels have been recently visited. So, by pressing back at this moment, the user would be navigated to the previously selected panel - Cookies. It doesn't matter that the panel actually comes from a Firebug extension.
By pressing forward, the user would be navigated into the Script panel (again, using the screenshot example). In this case there are two history entries, since the Script panel was used to display two script files in the past.
Tracking also selected files within a panel (this applies on the Script and CSS panels) is very useful feature. Instead of using the Script Location Menu again and again to pick the target script file (pretty tiring if there is a lots of scripts on the page), the user can just press back or use the history menu to navigate faster to already visited scripts. And yes, the scroll position within the script is also tracked so, you'll end up seeing the same piece of source code as before.
The same feature is now available also in Chromebug (since it's based on Firebug code base) and very useful for navigation among chrome script files.
This post is updated to reflect changes in the specification. You need Firebug 1.6X.0a12
Firebug 1.6X.0a12 implements a new console.table method that allows output of tabular data into the Console panel. This feature was suggested by Patrick Mueller who works on webkit based on a similar feature implemented in FirePHP by Christoph Dorn.
Before diving into various scenarios and details how to use this new method, let's see a simple preview of a tabular output.
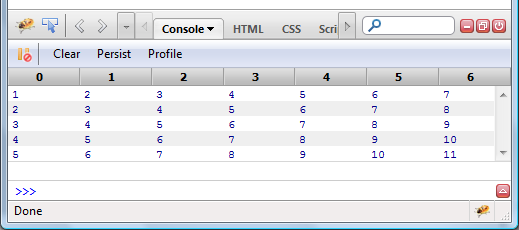
This table corresponds to a following code:
var table1 = new Array(5);
for (var i=0; i<table1.length; i++)
table1[i] = [i+1, i+2, i+3, i+4, i+5, i+6, i+7];
console.table(table1);
Read more...
I had a chance to take a closer look at a new (and I believe the first one!) book about Firebug, written by Chandan Luthra and Deepak Mittal. This book focuses on Firebug 1.5, which is the current release on AMO.

Arm yourself to destroy UI and JavaScript bugs.
After a brief introduction to Firebug and its history, the authors provide excellent and detailed description of all Firebug features (panel by panel) and so, the first half of the book represents a comprehensive reference guide for those who don't want to miss any tiny thing (gosh, I would love to have such info somehow directly accessible from within the FB UI).
The target audience is front-end web developers who are building software and pages using HTML, CSS, JavaScript, and AJAX, and want to learn Firebug. The book assumes that the reader has a very basic knowledge of HTML, JavaScript, and CSS. The examples in the book can be understood by someone who has just been introduced to web development.
The second half of the book was exciting for me. It starts with web page performance tuning and continues with description how to use Firebug for AJAX development. The last two chapters of this book are dedicated to Firebug extensions. You can find a list of some useful extensions as well as a great chapter about developing an extension of Firebug (including famous "Hello World!" example).
I think that there could have been more about how to effectively use Firebug in order to solve typical scenarios/issues, which developers meet in their daily work (improving download speed, profiling application logic, fixing design related bugs, learning unknown code & markup, etc) apart from listing all features.
Anyway, I highly recommend this book to everyone who is looking for complete and transparent overview of all Firebug features nicely explained and categorized. The book is worth reading!
Have you ever had a feeling that there is a missing option you would like to see in Firebug? Well, there is a chance it's there and you just didn't know about it.
In order to keep the UI simple (and we all know options are evil), some options/preferences doesn't have its own UI representation and are accessible only through well known about:config page in Firefox. Some of them really deserve being hidden, but I think there could be some you can find useful.
Since revealing these preferences from source code is quite tedious task, I did it for you and put together a list that summarizes those available in Firebug 1.5.
Note that one of the efforts of Firebug team is having a stronger sense of which features Firebug users actually use. In this particular case, it could reveal the fact that some hidden preferences are often changed and they could eventually made it into Firebug's UI (and vice versa). See more about Firebug user survey (so far still in academic phase). What do you think about this way of providing automated feedback? Could this help us to improve Firebug? (please reply here or on Firebug group)
Read more...
I have recently got several questions about how to understand the timing numbers provided by the Net panel in Firebug and so, I decided to write a quick summary explaining what everything is the Net panel actually measuring (in terms of time).
Just to note that there is already a post, I wrote a while ago, summarizing all other features of the Net panel using bunch of screen-shots.
This post is dedicated only to timings as it's being implemented in Firebug 1.5.3.
Read more...


