Subscribe to RSS Feed

Entire Firebug source base has been moved on github.com last week and we are also adopting a new GIT development workflow. So far, everyone has been truly excited by this change and I believe that it's also much better way how to collaborate with other coders. Firebug is an open source project after all.

So, for those who are interested at forking Firebug repository, issuing a pull request, developing Firebug extension, etc. here are some basic things to know before you start.

Firebug Repository

There are already several repositories in Firebug's account, but the one you are probably interested the most is firebug

https://github.com/firebug/firebug

The structure of the repo is following:

  • extension Firebug extension directory
  • tests Firebug automated test files and test harness - FBTest
  • trace Firebug tracing console - FBTrace

Here is how to clone the repository (read only):

$ git clone git://github.com/firebug/firebug.git
$ cd firebug/extension

Run Firebug From Source

The extension directory contains Firebug extension files and so, you can run Firebug off of it. It's also the best way how to quickly check your code changes.

  1. Locate your Firefox profile folder
  2. Open extensions/ folder, create if it doesn't exist.
  3. Create a new text file and put the full path to your development folder inside. (e.g. C:\firebug\extension\ or ~/firebug/extension/). Windows users should retain the OS' slash direction, and everyone should remember to include a closing slash and remove any trailing spaces.
  4. Save the file with Firebug ID as it's name firebug@software.joehewitt.com

Now you can modify the code base, restart Firefox (with Firebug extension installed) and see your changes live.

Build Firebug XPI

You probably don't need this that often, but you can also easily build Firebug XPI package. All you need is Apache Ant installed on your machine.

$ cd firebug/extension
$ ant

The result XPI file should be located in ./release directory.

Push!

And now the most interesting part. You fixed a bug or implemented new API you need in your extension and you want us to pull your changes, commit into Firebug master branch and release! Let's see what you need to do.

Update: it's useful to create a separate branch for every contribution you make. (related to #4 and #5)

  1. First, you need a GitHub account. It's simple and all the cool kids are already there 😉
  2. Fork Firebug repository (see how to fork a repo).
  3. Clone your fork onto your local machine (your URL will be different):
    $ git clone git@github.com:janodvarko/firebug.git
  4. Create a new branch, make your changes, stage/add modified files (e.g. firebug.js) and commit:
    $ cd firebug/extension
    $ git checkout -b myNewAPI
    # Make your changes in firebug.js file now
    $ git add content/firebug/firebug.js
    $ git commit -m "New API for my extension"
  5. Push to origin (your public fork), the local branch myNewAPI to the remote branch myNewAPI:
    $ git push -u origin myNewAPI
  6. Send a pull request. We'll review your changes and accept if all is OK!

Our release cycle is quick (a release at least every other week) so, your changes can be publicly available pretty soon!

Or Create a Patch

If you don't like github.com from some reason you can always create read-only clone (see at the beginning of this post), make your changes and generate a patch:

$ git diff > my-new-api.js

... or using svn:

$ svn diff > my-new-api.js

Finally, create a new issue report (Firebug official issue list is still at the same location) and attach your patch. Again, we'll review your changes and accept if all is OK!

Further Resources

This powerful Firebug's feature, which you can download from the internet, could be also called Edit value and continue (to use similar terminology from Visual Studio). Even if Firefox (and so Firebug) doesn't allow to edit the code itself at run-time, being able to change value of a variable while sitting at a breakpoint in the debugger is often very useful way how to check proper behavior of your code.

Let's see a simple example:

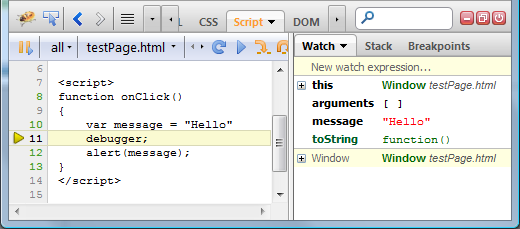
The debugger is halted at a debugger keyword (see another related tip) and the Watch panel shows that value of the message variable is Hello.

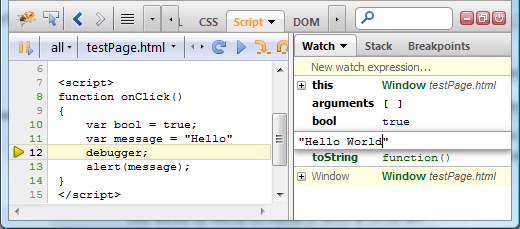
Double click on the variable in the Watch panel opens an inline editor, which allows to change its value (double-clicking on a boolean value would automatically toggle the value).

Change the value, press enter key and consequently F5 to resume the debugger. You'll see that the new value has been dynamically applied.

Note that you can edit only primitive values, but not matter where they are actually stored. They might live within global or local variables, objects or within arrays.

Check summary of all Firebug tips.

The Persist feature has been available in Firebug for some time already, but I recently got several questions indicating that it doesn't have the visibility it deserves. So, let's introduce it quickly.

Firebug UI resets every time the current browser tab is refreshed or navigated to another page - to show the new state. The consequence is that all Firebug panels trash the content (i.e. the Net or Console panel entries are lost).

This is fine since usually the user doesn't want to keep the entire history. But what in the case when you want to debug the transition process between page loads or redirects?

And this is exactly when the Persist button becomes practical...

The Persist button

Read more...

Firebug 1.8b3 introduces a new API that can be used to create time-stamps during Javascript execution and compare them together with HTTP traffic timing on the timeline in the Net panel: console.timeStamp();

This feature is useful in cases where the developer needs to know when particular piece of Javascript code is executed relatively to the HTTP request made by web page. Especially in cases when Javascript is loaded through dynamically appended <script> tags or through XHR and evaluated using eval().

See the following screenshot that shows a time-stamp generated during a page load.

Time-stamp generated using console.timeStamp() method.

The time stamp is also displayed in the Console panel so, you can compare with other logs.

The rest of this post demonstrates this feature on couple of live examples in detail. So, if you are interested what you can do with Firebug 1.8, read further!

Read more...

A lot is happening these days and I bet you already know about Firefox 4 + Firebug 1.7 releases. You might also seen some of the new features introduced in Firebug 1.7 and so, I won't repeat that.

I'd like to focus on changes related to page load process and script execution in Firefox 4. Apart from many performance improvements script execution changed to be more HTML5 compliant and Firebug is an excellent tool that can be used to analyze & understand what is going on under the hood.

Thanks to Henri Sivonen for his excellent post about Script Execution Changes in Firefox 4 that served as the main source of information for me!

Read more...

Firebug 1.7 (currently beta 1 available) improves API related to Infotips. These Infotips are used in Firebug UI for displaying additional information.

They are similar to tooltips but can provide a richer content (comparing to those in HTML). The content doesn't have to be only a text but any HTML. In fact, the content is usually generated using Domplate.

Let's see how to utilize these Infotips in Firebug extensions.

Infotip in Firebug UI

First, see how infotips actually look like. Since they are implemented in HTML and Firebug uses HTML only for panel content (so far) they appear in panels.

The first image comes from the Script panel. The mouse is hovering over a variable and the infotip shows its value.

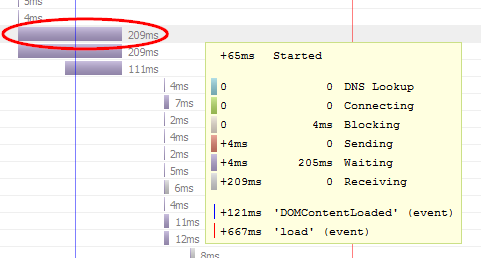
The next infotip is displayed within the Net panel. It shows detailed timing info for selected (note the gray background) HTTP request entry.

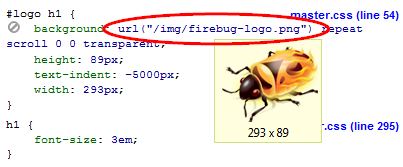
And the last example shows preview of an image when the user hovers mouse over a CSS property with background URL.

Read more...

The only initial UI - visible just after installing Firebug - is an icon placed at the bottom of the browser window, which I believe is the kind of minimalistic UI users want.

  • The user deserves a clear result after the installation - "oh, there is Firebug now".
  • The UI is minimal enough so it doesn't disturb the user when Firebug is not used.

Firebug Start Button

(I am going to call this icon Firebug Start Button)

Another important role of this tiny UI is informing the user whether Firebug is currently activated (the icon is shining and colorful) or deactivated (grayed out). This is useful to know since having Firebug activated costs more CPU cycles. Also, don't forget, number of errors is displayed next to it (in case of any errors on the page).

Firebug Start Button

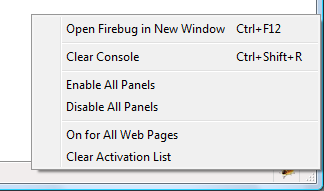
Clicking on the icon opens the real Firebug UI and right clicking on it, opens a context menu with some actions that might be useful at this moment.

Firebug Start Button

So, far so good.

Read more...

Firebug 1.6.0 is available on AMO since yesterday and one thing all Firebug (extension) developers could be looking for is probably the tracing console that displays logs coming from Firebug itself.

Sometimes, the only way how to debug a debugger is to put logs into the code to see what's really happening inside.

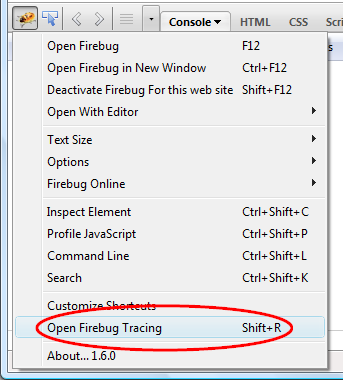
This tracing console is part of every release that is marked with 'X' (see wiki) and is easily accessible from Firebug menu (or through Shift+R shortcut).

Open Firebug Tracing menu item

See more about this console if it's new for you.

Since the console is useful only for Firebug developers and not for Firebug users, it's removed from the final release. However, it's obvious that having the console still available can be useful. From this reason, I have created a simple extension that brings the console back and so, developers can tune their extensions for final releases.

All you need to do is install a Tracing Console extension together with Firebug 1.6.0 and voilà the Open Firebug Tracing menu item is back.

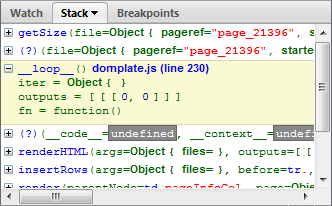
One of the improvements in Firebug 1.6b3 is better design for the Stack side panel that is available if the debugger is hanging e.g. on a breakpoint, displaying list of function calls that are currently on the stack.

Reported as issue 3520.

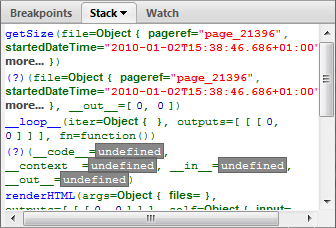
A picture is worth a thousand words (especially in this case) and so, see how the panel looks in good old Firebug 1.5.

Stack side panel in Firebug 1.5

Each function call is represented by a function name followed by a list of arguments. The mess here is caused by spreading this info over more lines. The result: it's hard to distinguish individual frames.

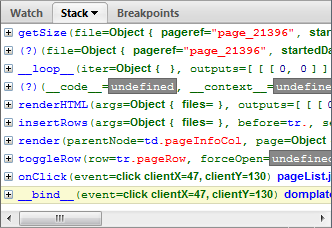
Here is how we redesigned it for Firebug 1.6:

Stack side panel in Firebug 1.6b2

Only one function call per line. Yes, this means there is usually a horizontal scroll bar, but the user can expand each function to see list of all arguments without scrolling. See the next screen-shot.

Stack side panel showing expanded parameters

Thanks to Steven Roussey and Sebastian Zartner for the input they had when implementing this!

Any other ideas how this could be yet improved?
What would you expect to see in a tooltip (if any)?

Many things are happening in the Firebug universe every day and there are several channels you can follow to make sure you don't miss anything what matters to you.

I believe it deserves at least this little post to summarize the most important of them and provide a short description so, one can decide what is the most appropriate source of information to follow.

  • getfirebug.com Of course, this site is the real center of Firebug universe. It accumulates all about Firebug.
  • Firebug Blog The official Firebug blog is (among other things) broadcasting news about every released Firebug version, describing changes and fixed bugs.
  • @firebugnews Are you consuming all news via Twitter? Then follow us there! Firebugnews channel is listening and (re)tweeting about things that are interesting for Firebug users and developers.
  • Newsgroup Are you a Firebug contributor and/or Firebug extension developer? Then being member of this group is essential.
  • Firebug Wiki Wiki is not real news channel, but I couldn't miss it in this list since it's simply the best source of information about Firebug features and internals.

Other Firebug Links.

Finally, you can also follow this blog.

« Previous PageNext Page »