A lot is happening these days and I bet you already know about Firefox 4 + Firebug 1.7 releases. You might also seen some of the new features introduced in Firebug 1.7 and so, I won't repeat that.
I'd like to focus on changes related to page load process and script execution in Firefox 4. Apart from many performance improvements script execution changed to be more HTML5 compliant and Firebug is an excellent tool that can be used to analyze & understand what is going on under the hood.
Thanks to Henri Sivonen for his excellent post about Script Execution Changes in Firefox 4 that served as the main source of information for me!
Read more...
Firebug 1.7 (currently beta 1 available) improves API related to Infotips. These Infotips are used in Firebug UI for displaying additional information.
They are similar to tooltips but can provide a richer content (comparing to those in HTML). The content doesn't have to be only a text but any HTML. In fact, the content is usually generated using Domplate.
Let's see how to utilize these Infotips in Firebug extensions.
Infotip in Firebug UI
First, see how infotips actually look like. Since they are implemented in HTML and Firebug uses HTML only for panel content (so far) they appear in panels.
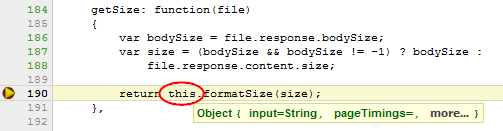
The first image comes from the Script panel. The mouse is hovering over a variable and the infotip shows its value.
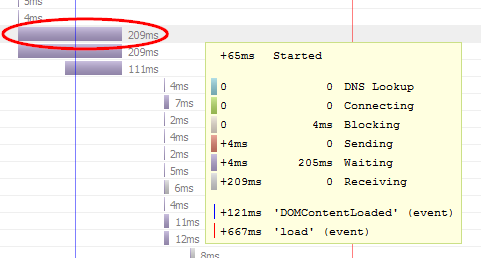
The next infotip is displayed within the Net panel. It shows detailed timing info for selected (note the gray background) HTTP request entry.
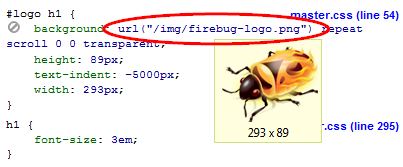
And the last example shows preview of an image when the user hovers mouse over a CSS property with background URL.
Read more...
Debugging a debugger is a tricky business. You often need another debugger, but it can also be broken and so, that's why Firebug team has invented a set of helper tools that are essential for Firebug development.
In this post I am providing a brief summary of tools that we use when working on Firebug.
Take a sneak peek into the world of Firebug development and see what is it composed from!
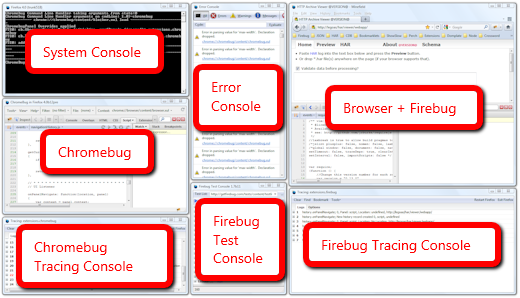
Click to enlarge the image.
- Browser + Firebug Of course, this is the essential window. The browser window with Firebug opened at the bottom (there is usually not enough space on the screen to have Firebug detached in a new window).
- Firebug Tracing Console If something goes wrong in Firebug there is a Firebug Tracing Console. This console displays various logs recorded as Firebug is running. This is often the window where we can sight an error and using associated stack trace discover the right place withing the Firebug source and start debugging.
- Chromebug This is the Firebug debugger. Chromebug is based on Firebug source base (the UI is the same). It allows debugging any Firefox extension (aka Firebug for Firefox extensions), well except of Chromebug itself. Invented by awesome John J. Barton and indispensable for Firebug development.
- Chromebug Tracing Console Even Chromebug can be attacked by bugs and so, this tracing console displays logs coming from Chromebug source. There is no other debugger for Chromebug so, it's often the only way how to fix a bug in Chromebug.
- Firefox Error Console If everything else is broken we also use Firefox Error Console. It's pretty old, no stack trace, often useless.
- System Console At some point good old dump() into the system console can be also an effective strategy how to hunt a bug. Slow, sometimes frustrating, but hey, software isn't always easy!
- Firebug Test Console Finally, in order to verify that Firebug is still working, after a bug dies, we have a set of tests. This console represents the test harness that run our automated tests and displays results.
Some of these tools are integrated and so, for example, Test Console also uses FB Tracing Console, Chromebug can be opened by clicking on a stack trace in the FB Tracing console, bug in the Test Console can be hunted using Chromebug, etc.
Frankly, isn't that all exciting?! 🙂
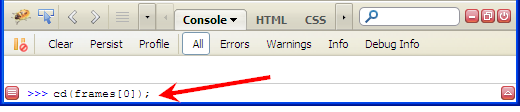
Firebug command line allows executing JavaScript expressions within context of the current page. Firebug also provides a set of built in APIs and one of them is cd().
cd(window) By default, command line expressions are relative to the top-level window of the page, cd() allows you to use the window of a frame in the page instead.
There is several ways how to use this method. First, let's imagine following page:
<html xmlns="http://www.w3.org/1999/xhtml">
<head>
<title>Console Test Page</title>
</head>
<body>
<iframe id="frameID" name="frameName" src="iframe.html" />
</body>
</html>
cd(document.getElementById("frameID").contentWindow); switch to a frame by IDcd(window.frames[0]); switch to the first frame in the list of framescd(window.frames["frameName"]); switch to a frame using by namecd(window.top); switching back to the top level window
Check the example page online.
See all Firebug tips
Firebug inspector is certainly one of the most valuable Firebug features and it also deserves more attention from extension developers. From this reason Firebug 1.7a10 introduces a new API that allows reusing this feature in Firebug extensions and customize its behavior.
This part of Firebug extension tutorial explains how to use this API in Firebug extensions.
Firebug Inspector
Let's see a quick overview of what is actually the Firebug inspector and how it works from the user perspective.
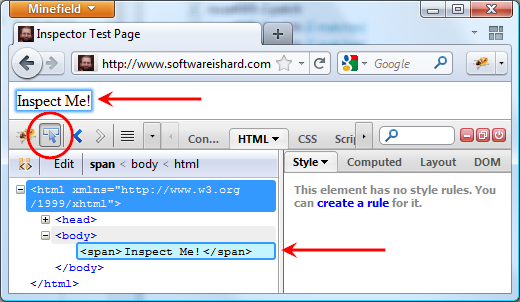
- Clicking on the inspector button starts an inspecting mode.
- As the user moves the mouse cursor over page elements, they are automatically highlighted.
- The HTML panel (selected by default) shows detailed information about the currently highlighted element.
- The inspecting mode can finished by clicking on the inspecting page element or canceled by pressing ESC key.
Read more...
One way how to break JavaScript execution and let a debugger to halt on specific line of source code is using a breakpoint. Less known alternative (and also less useful I guess) is a debugger keyword.
One obvious drawback of using this keyword is lack of flexibility. You need to modify the source code to use it and modify again to get rid of it.
A problem has come up when you need to debug a code that contains debugger keywords and you can't remove it. And this is where Firebug can become handy tool again.
See all Firebug tips
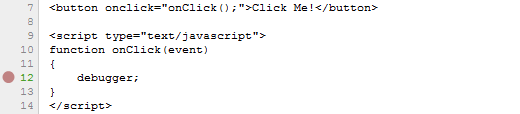
Let's image following script:
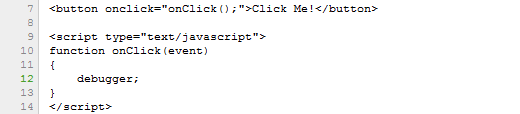
If onClick method is executed Firebug shows following bubble that offers disabling.
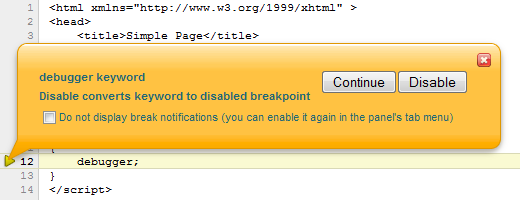
The 'Do not display...' check-box has been introduced in Firebug 1.7a10.
If you pressed the Disable button, a disabled breakpoint has been created on the same line. A breakpoint has higher priority over debugger keyword and since it's disabled it also effectively disables the keyword.
It's just a standard breakpoint so, you can remove it in the Breakpoints side panel. If you have Firebug installed try it now, otherwise you need to install it first.
The feature I am going to describe in this post would definitely deserve a better visual representation since almost nobody I've asked doesn't know about it.
Anyway, despite this visual imperfection it's very useful for any developer who deals with pages that contain number of script files.
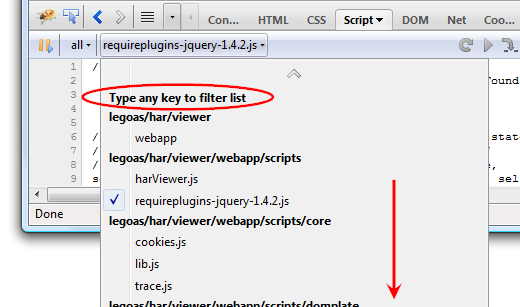
See the following screen-shots. It shows a list of scripts included in the current page.
See all Firebug tips
The list of scripts is pretty long (didn't fit in the image) and you even need to scroll the menu content to see its end. Important is the plain Type any key to filter list note at the top!
If you start typing at this moment, the list will be automatically filtered.
Read more...
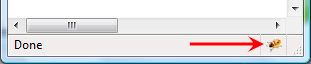
The only initial UI - visible just after installing Firebug - is an icon placed at the bottom of the browser window, which I believe is the kind of minimalistic UI users want.
- The user deserves a clear result after the installation - "oh, there is Firebug now".
- The UI is minimal enough so it doesn't disturb the user when Firebug is not used.
(I am going to call this icon Firebug Start Button)
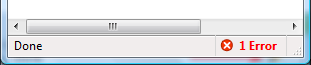
Another important role of this tiny UI is informing the user whether Firebug is currently activated (the icon is shining and colorful) or deactivated (grayed out). This is useful to know since having Firebug activated costs more CPU cycles. Also, don't forget, number of errors is displayed next to it (in case of any errors on the page).
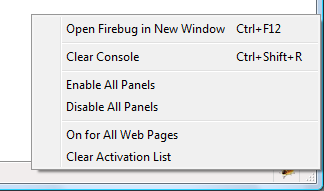
Clicking on the icon opens the real Firebug UI and right clicking on it, opens a context menu with some actions that might be useful at this moment.
So, far so good.
Read more...
Firebug 1.6.0 is available on AMO since yesterday and one thing all Firebug (extension) developers could be looking for is probably the tracing console that displays logs coming from Firebug itself.
Sometimes, the only way how to debug a debugger is to put logs into the code to see what's really happening inside.
This tracing console is part of every release that is marked with 'X' (see wiki) and is easily accessible from Firebug menu (or through Shift+R shortcut).

See more about this console if it's new for you.
Since the console is useful only for Firebug developers and not for Firebug users, it's removed from the final release. However, it's obvious that having the console still available can be useful. From this reason, I have created a simple extension that brings the console back and so, developers can tune their extensions for final releases.
All you need to do is install a Tracing Console extension together with Firebug 1.6.0 and voilà the Open Firebug Tracing menu item is back.
One of the improvements in Firebug 1.6b3 is better design for the Stack side panel that is available if the debugger is hanging e.g. on a breakpoint, displaying list of function calls that are currently on the stack.
Reported as issue 3520.
A picture is worth a thousand words (especially in this case) and so, see how the panel looks in good old Firebug 1.5.
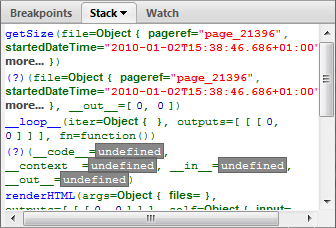
Each function call is represented by a function name followed by a list of arguments. The mess here is caused by spreading this info over more lines. The result: it's hard to distinguish individual frames.
Here is how we redesigned it for Firebug 1.6:
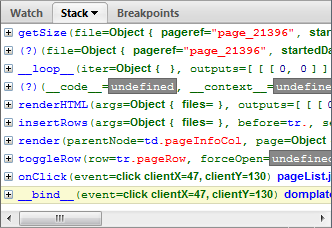
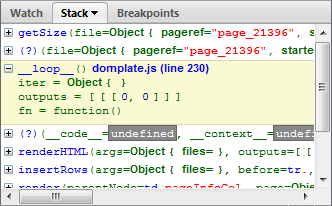
Only one function call per line. Yes, this means there is usually a horizontal scroll bar, but the user can expand each function to see list of all arguments without scrolling. See the next screen-shot.
Thanks to Steven Roussey and Sebastian Zartner for the input they had when implementing this!
Any other ideas how this could be yet improved?
What would you expect to see in a tooltip (if any)?


