The only initial UI - visible just after installing Firebug - is an icon placed at the bottom of the browser window, which I believe is the kind of minimalistic UI users want.
- The user deserves a clear result after the installation - "oh, there is Firebug now".
- The UI is minimal enough so it doesn't disturb the user when Firebug is not used.
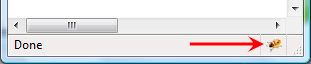
(I am going to call this icon Firebug Start Button)
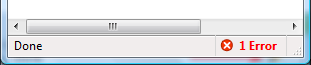
Another important role of this tiny UI is informing the user whether Firebug is currently activated (the icon is shining and colorful) or deactivated (grayed out). This is useful to know since having Firebug activated costs more CPU cycles. Also, don't forget, number of errors is displayed next to it (in case of any errors on the page).
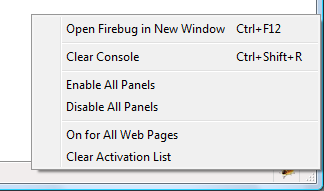
Clicking on the icon opens the real Firebug UI and right clicking on it, opens a context menu with some actions that might be useful at this moment.
So, far so good.
Read more...
Firebug 1.6.0 is available on AMO since yesterday and one thing all Firebug (extension) developers could be looking for is probably the tracing console that displays logs coming from Firebug itself.
Sometimes, the only way how to debug a debugger is to put logs into the code to see what's really happening inside.
This tracing console is part of every release that is marked with 'X' (see wiki) and is easily accessible from Firebug menu (or through Shift+R shortcut).

See more about this console if it's new for you.
Since the console is useful only for Firebug developers and not for Firebug users, it's removed from the final release. However, it's obvious that having the console still available can be useful. From this reason, I have created a simple extension that brings the console back and so, developers can tune their extensions for final releases.
All you need to do is install a Tracing Console extension together with Firebug 1.6.0 and voilà the Open Firebug Tracing menu item is back.
One of the improvements in Firebug 1.6b3 is better design for the Stack side panel that is available if the debugger is hanging e.g. on a breakpoint, displaying list of function calls that are currently on the stack.
Reported as issue 3520.
A picture is worth a thousand words (especially in this case) and so, see how the panel looks in good old Firebug 1.5.
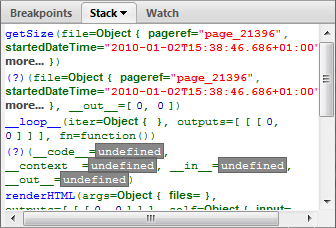
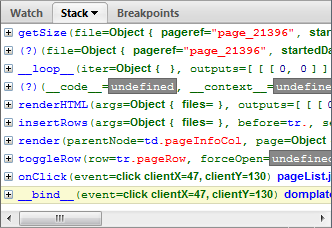
Each function call is represented by a function name followed by a list of arguments. The mess here is caused by spreading this info over more lines. The result: it's hard to distinguish individual frames.
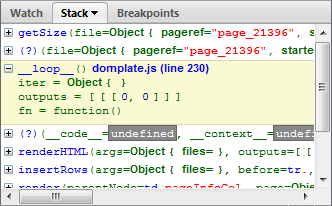
Here is how we redesigned it for Firebug 1.6:
Only one function call per line. Yes, this means there is usually a horizontal scroll bar, but the user can expand each function to see list of all arguments without scrolling. See the next screen-shot.
Thanks to Steven Roussey and Sebastian Zartner for the input they had when implementing this!
Any other ideas how this could be yet improved?
What would you expect to see in a tooltip (if any)?
Here is a brief tip post about the well known Firebug's inspector feature and its integration with the command line.
You need Firebug 1.7a4 that fixes a bug in command line APIs (the fix will be ported into 1.6b3)
When the inspector is used to inspect the current page, Firebug is automatically keeping a history of recent inspected elements. The history is consequently accessible in the command line through following command line APIs.
$0 The currently selected object in the inspector.$1 The previously selected object in the inspector.$n(index) Access to an array of last 5 inspected elements.
See all Firebug tips
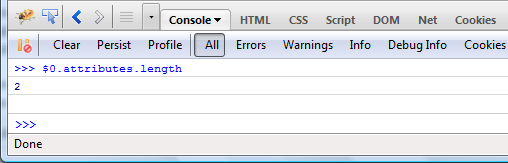
So, you can use $0 as a variable pointing to the currently inspected element and pass it to another functions or access it's properties.
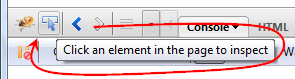
For example, right click on the above screen-shot and pick Inspect Element. Switch to the Console panel and use $0 in the command line to get number of attributes.
jQuery in the command line
Here is another example that uses jQuery APIs in the command line. The $0 element is passed into the jQuery function as a parameter (slideUp method animates the height of the element).
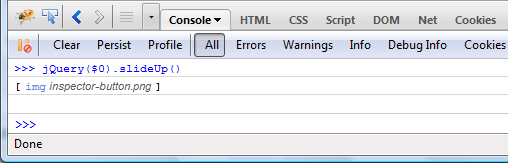
If the current page doesn't use jQuery, you can install it quickly using a jQuerify bookmarklet.
Many things are happening in the Firebug universe every day and there are several channels you can follow to make sure you don't miss anything what matters to you.
I believe it deserves at least this little post to summarize the most important of them and provide a short description so, one can decide what is the most appropriate source of information to follow.
- getfirebug.com Of course, this site is the real center of Firebug universe. It accumulates all about Firebug.
- Firebug Blog The official Firebug blog is (among other things) broadcasting news about every released Firebug version, describing changes and fixed bugs.
- @firebugnews Are you consuming all news via Twitter? Then follow us there! Firebugnews channel is listening and (re)tweeting about things that are interesting for Firebug users and developers.
- Newsgroup Are you a Firebug contributor and/or Firebug extension developer? Then being member of this group is essential.
- Firebug Wiki Wiki is not real news channel, but I couldn't miss it in this list since it's simply the best source of information about Firebug features and internals.
Other Firebug Links.
Finally, you can also follow this blog.
It's been a while since I published the last part of my Extending Firebug Tutorial and it looks like it's time to continue.
I have been inspired by an interesting thread started recently on Firebug newsgroups and I decided to write a part related to Firebug Activable Panels and Modules.
The activation support is useful in cases when the user doesn't need specific Firebug features and disables them in order to avoid performance penalties. A simple example can be a web designer that doesn't need JavaScript debugger and so, keeps the Script panel disabled.
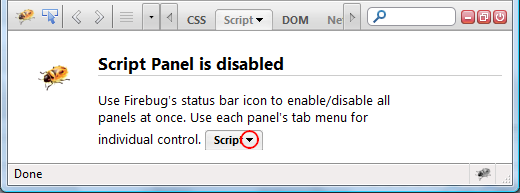
There are two ways how to enable (or disable) a panel. The first option is to use the mini tab menu available next to the panel's label.
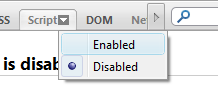
Notice that all panel related options (if any) will be displayed underneath of these two menu items (see, how to provide such options in part III.)
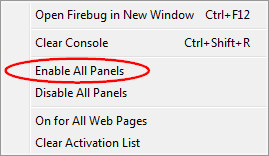
The second possibility is to use the status bar icon menu (be careful this UI will most likely change in Firefox 4.0).
So, if you are a Firebug/Extension developer read more about activable APIs and how to create an extension with an activation support.
Read more...
I couldn't find a better label for a fix that landed in the latest Firebug 1.7 (and will be backported into 1.6), but I am sure that a few Firebug screenshots will clarify it well enough.
The bug has been reported for some time and it's related to panels that display breadcrumbs.
Here is what these breadcrumbs mean in context of a panel.
- HTML displays XPath for the selected element.
- Script shows the stack trace when hanging on a breakpoint.
- DOM displays the position of the selected object within DOM hierarchy.
The problem appeared when the breadcrumb information was so long that it went off the screen. Here is an example of the Script panel with long stack trace.
See, the stack trace even pushed the debugger buttons of the panel and it's only possible to debug using keyboard.
Here is the fixed version.
The HTML (and DOM) panel is also fixed, in case of a deep hierarchy of elements (and long XPath) there are, again, a little arrow buttons that allow to scroll and see the entire value.
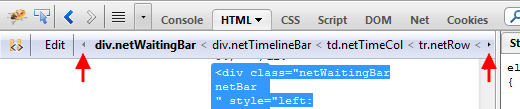
Note that scrolling can be done by:
- clicking on the small arrow
- moving mouse over the small arrow
- using mouse wheel
- using keyboard (you need to check Enable Accessibility Enhancements in Firebug options)
We have been working on version 1.6 since the end of January this year and after twenty alpha releases we have first beta!
Switching into the beta phase means a few things for Firebug 1.6 users and developers:
- Feature freeze. No new features for 1.6, we are now only fixing bugs, improving stability and compatibility with Firefox 4.0
- Firebug 1.7 (alpha) branch has been created and all contributors and active developers are switching to it. Any new ideas and features belongs into this branch.
- We appreciate feedback from beta users! Please, let us know about any problems in the newsgroup or file a bug (there are Firefox 4.0 known issues).
- If you are a translator, please help us to get rest of the strings done. Firebug locales are managed on Babelzilla.
John J. Barton already put together a list of new features on getfirebug.com blog, but it's too awesome so, let me repeat that and add a little descriptions.
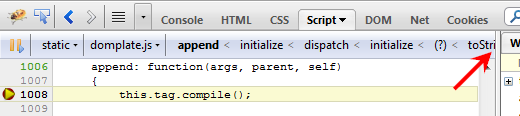
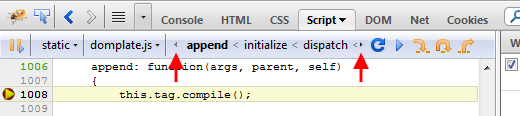
- Back and Forward arrows in the toolbar Have you ever wanted to just quickly switch to the previous Firebug panel - or to a previous file displayed within the Script panel? Now, you can just click back...
- Scrolling Panels Tab Bar Do you have a bunch of Firebug extensions installed and there is not enough space for all the panel-tabs? This problem is now solved by scrolling.
- Command line available on all panels Firebug command line is one of the strongest features and so, it's now possible to use it from any panel. So, for example, you can evaluate an expression while hanging out at a breakpoint in the Script panel.
- Implemented console.table New method for well known console object that allows to log various data structures using tabular format. Not only the layout is useful, but you can also sort by columns.
- Disabling break on next error When Firebug debugger hits a debugger; keyword on the page, it breaks the current execution (it works like a breakpoint in the source code). The news is that you can temporarily disable it using disabled breakpoint (a breakpoint with condition set to false).
- MozAfterPaint events Painting events can be tracked by the Net panel and displayed on the graphical timeline together with all the other events and HTTP requests.
- Net panel reports BFCache hits In order to make back/forward (BF) browsing and startup fast, Firefox uses a cache (note that it isn't the HTTP cache). Firebug now reports also reads coming from this cache.
- Option to use en-US locale Firebug UI can be switched into the default en-US locale even if Firefox uses different locale. Useful for developers who use localized Firefox but want Firebug in English.
- First Run Page A first run page is now displayed after an install or update. We want to keep you updated through this page.
- Testbot results Results from automated test-bot are continuously displayed on getfirebug.com. Anybody can run automated Firebug test suite and upload results to that page (so we can see that even rare configurations work).
- Console Filtering The Console panel allows to filter its content using a toolbar buttons. You can filter by: error, warning, info, debug or display all logs at once.
We have also fixed many bugs, compatibility issues, memory leaks and I see Firebug 1.6 as the best version ever.
Firebug 1.6 is slowly approaching a beta phase and one of the last features we have put in a18 is related to localization. Note that Firebug is currently using more than 500 strings in its UI and these are translated into approximately 40 languages.
Even if we are always planning a string freeze in order to give Firebug translators some time to process new strings, we often end up with a few unfinished locales.
This is a problem especially for DTD entities since missing entity causes fatal error and in case of Firebug - not loading the extension at all (XUL overlay is not loaded). The problem is not that critical if the missing string comes from a *.properties file, since these are scriptable and we can handle the missing-string-exception in Javascript. The only issue is what to display in the UI instead.
From these reasons we decided to do following:
- Don't use DTD entities
- Use en-US as fallback locale (for missing strings)
And as a bonus (!), these changes allowed to fix Issue 907: Option to use en-US locale instead of fx default locale
So, all you need to do to always use Firebug with en-US locale, is to set
extensions.firebug.useDefaultLocale
preference to true. There is no UI in Firebug for this option and so, you need to use about:config (see all prefs in Firebug).
Do you think this should be available in Firebug->Options menu?
Read further, if you interested how we implemented that.
Read more...
Another new feature that made it into Firebug 1.6a14 (available later today) is tracking HTTP responses coming directly from Firefox BFCache (back/forward cache) and displaying them within the Net panel.
The purpose of this cache (note that this is different from the standard HTTP cache) is to make navigation in the browser history fast.
The consequence of using the BFCache is that there is no HTTP activity (that's why it's fast) and so, till now these requests wasn't displayed in the Net panel.
While I think it was actually correct (since purpose of the Net panel is to monitor HTTP activity), it was confusing sometimes as the Net pane was empty even if it was quite obvious that there need to be some requests.
So, the feature is optional (on by default).

All responses coming from the BFCache are displayed in gray. See the next screen-shot that shows what happened when I pressed the Back button.

One thing I am still not sure about is whether the gray color is enough to distinguish BFCache responses from regular HTTP responses...
Another way how to differentiate these two different responses is depicted here (just a mock-up):

BFCache response could be hidden behind an extra entry that clearly depicts that it's BFCache related. This would make the Timeline column a bit hard to read since there would be empty rows in the waterfall diagram, but perhaps nobody is interested in that if it doesn't come from the server and there is not HTTP communication anyway.
What do you think?
Any tips how to cut the Gordian knot?


